> ## Documentation Index
> Fetch the complete documentation index at: https://docs.skyhook.io/llms.txt
> Use this file to discover all available pages before exploring further.
# Home Dashboard
> Your org at a glance — cluster health, recent deployments, active issues, and workloads — on a single landing page.
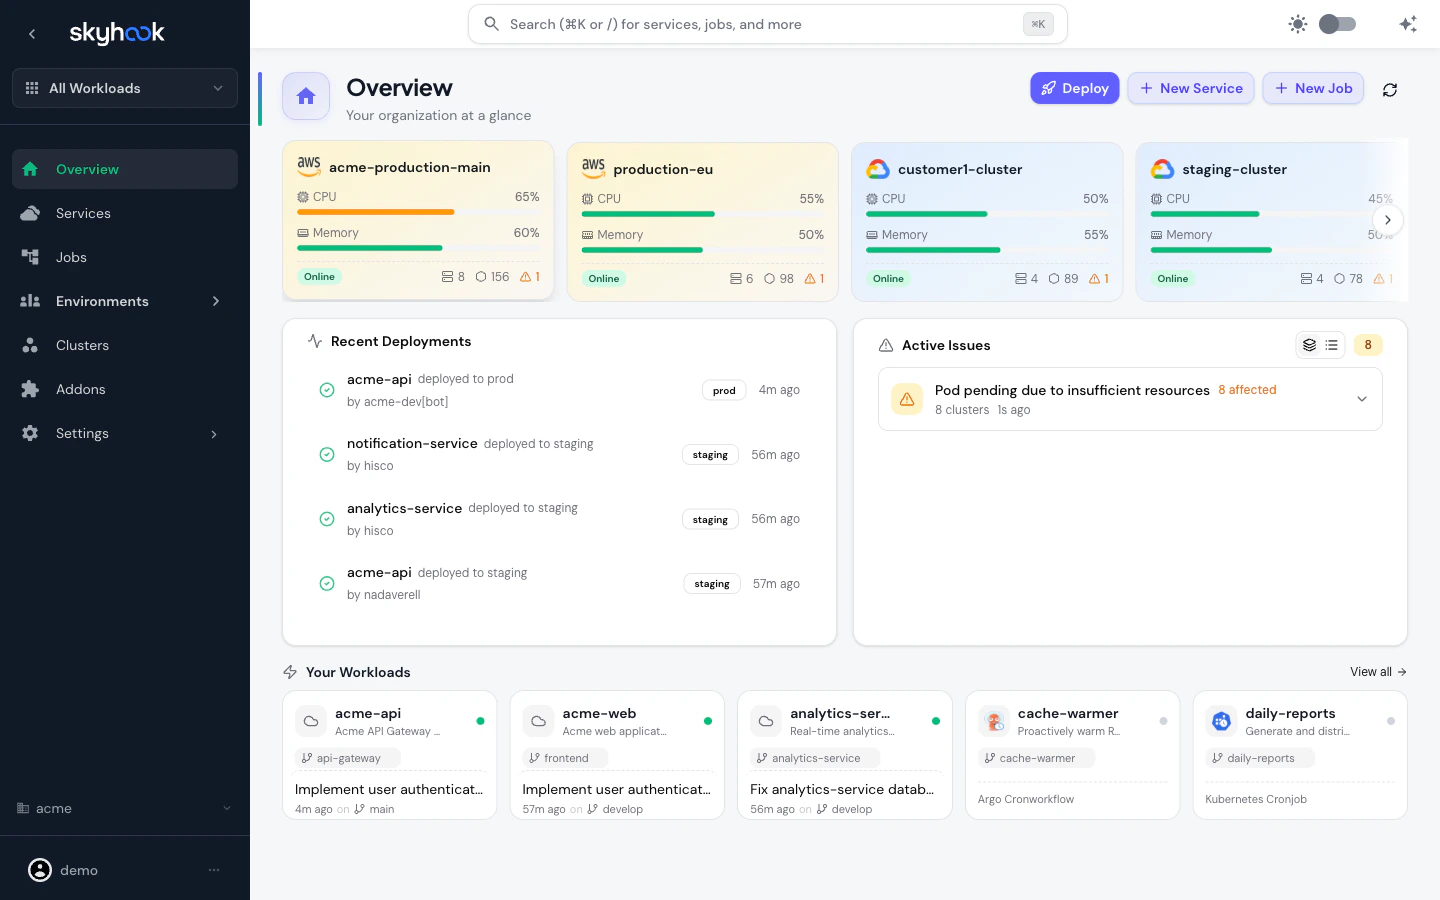
When you log into Skyhook, the **Home** page is the first thing you see. It's an overview of your organization's Kubernetes footprint on a single screen: cluster health, recent deployments across every service, active issues that need attention, and quick access to your workloads.
 ## Layout
### Quick actions
The top-right of the page has three buttons:
* **Deploy** — opens the deploy dialog for any service
* **New Service** — opens the service creation wizard
* **New Job** — opens the job creation wizard
These are hidden when no clusters are connected (since you can't deploy anywhere), and replaced with onboarding guidance.
### Cluster health cards
One card per connected cluster, sorted by size and arranged in a horizontally-scrollable row with fade edges. Each card shows:
* **Cluster name** and **cloud provider** — color-coded for AWS, GCP, Azure so you can tell providers apart at a glance
* **CPU and memory utilization** (percent of total cluster capacity in use)
* **Node count** and **pod count**
* **Status** — Online, Inactive, Error, or Configured
* **Issues** — hover to see active issues affecting the cluster, with direct links to the resources
Clicking a cluster card opens its detail page.
### Recent Deployments
A live feed of the most recent deployments **across every service in the org**, not just one. Each row shows:
* Service name
* Target environment
* Who deployed it
* Time ago
Click any row to jump to the specific deployment in that service's Deployments tab. The feed covers the last 5 days.
### Active Issues
Surfaces cluster-level problems that need attention. Two view modes:
* **Grouped view** — one row per issue type, showing how many clusters are affected and which specific resources. Each group expands to reveal the full list.
* **Flat view** — one row per affected resource, with a rich hover tooltip showing full details.
Each issue has clickable resource links that jump directly to the affected resource in the cluster resource viewer.
Common issues surfaced here:
* Pods pending due to insufficient resources
* ImagePullBackOff / CrashLoopBackOff
* Node conditions (MemoryPressure, DiskPressure, PIDPressure)
* Persistent volume claims that can't bind
### Your Workloads
A grid of the services and jobs in your org, with a **View all** link to the full list. Each card shows the workload name, a description, the type (api-gateway, frontend, argo cronworkflow, kubernetes cronjob, etc.), and the most recent commit message and time.
## Onboarding experience (new orgs)
The home dashboard adapts to your setup state so new users always know what to do next:
The dashboard is replaced with a **Welcome to Skyhook** experience that offers a **Connect Cluster** button and a guided **Setup Wizard**. Quick action buttons (Deploy, New Service, New Job) are hidden because they wouldn't do anything useful yet.
The cluster health and active issues sections work as normal. The **Your Workloads** section shows an **Add a service to Skyhook** card pointing to the create/import flow, and the recent activity feed shows a friendly **No recent activity** message with a pointer toward deploying your first service.
Services, Jobs, Clusters, Environments, Addons, and FinOps all show a setup checklist when critical prerequisites are missing, rather than empty or broken states. Each one offers a **Connect Cluster** action and a **Setup Wizard** so new users never hit a dead end.
## Troubleshooting
Hard-refresh the page. If it still doesn't load, check the browser console for errors and reach out to support.
The feed shows deployments from the **last 5 days**. If your org has been quiet longer than that, the feed will be empty — this is expected. Click any service in **Your Workloads** to see its full deployment history.
The cluster agent can't reach Skyhook. Click the card to open the cluster detail page, then check the agent status. Common causes: the agent pod isn't running, outbound connectivity is blocked, or the connector chart needs an upgrade.
## Layout
### Quick actions
The top-right of the page has three buttons:
* **Deploy** — opens the deploy dialog for any service
* **New Service** — opens the service creation wizard
* **New Job** — opens the job creation wizard
These are hidden when no clusters are connected (since you can't deploy anywhere), and replaced with onboarding guidance.
### Cluster health cards
One card per connected cluster, sorted by size and arranged in a horizontally-scrollable row with fade edges. Each card shows:
* **Cluster name** and **cloud provider** — color-coded for AWS, GCP, Azure so you can tell providers apart at a glance
* **CPU and memory utilization** (percent of total cluster capacity in use)
* **Node count** and **pod count**
* **Status** — Online, Inactive, Error, or Configured
* **Issues** — hover to see active issues affecting the cluster, with direct links to the resources
Clicking a cluster card opens its detail page.
### Recent Deployments
A live feed of the most recent deployments **across every service in the org**, not just one. Each row shows:
* Service name
* Target environment
* Who deployed it
* Time ago
Click any row to jump to the specific deployment in that service's Deployments tab. The feed covers the last 5 days.
### Active Issues
Surfaces cluster-level problems that need attention. Two view modes:
* **Grouped view** — one row per issue type, showing how many clusters are affected and which specific resources. Each group expands to reveal the full list.
* **Flat view** — one row per affected resource, with a rich hover tooltip showing full details.
Each issue has clickable resource links that jump directly to the affected resource in the cluster resource viewer.
Common issues surfaced here:
* Pods pending due to insufficient resources
* ImagePullBackOff / CrashLoopBackOff
* Node conditions (MemoryPressure, DiskPressure, PIDPressure)
* Persistent volume claims that can't bind
### Your Workloads
A grid of the services and jobs in your org, with a **View all** link to the full list. Each card shows the workload name, a description, the type (api-gateway, frontend, argo cronworkflow, kubernetes cronjob, etc.), and the most recent commit message and time.
## Onboarding experience (new orgs)
The home dashboard adapts to your setup state so new users always know what to do next:
The dashboard is replaced with a **Welcome to Skyhook** experience that offers a **Connect Cluster** button and a guided **Setup Wizard**. Quick action buttons (Deploy, New Service, New Job) are hidden because they wouldn't do anything useful yet.
The cluster health and active issues sections work as normal. The **Your Workloads** section shows an **Add a service to Skyhook** card pointing to the create/import flow, and the recent activity feed shows a friendly **No recent activity** message with a pointer toward deploying your first service.
Services, Jobs, Clusters, Environments, Addons, and FinOps all show a setup checklist when critical prerequisites are missing, rather than empty or broken states. Each one offers a **Connect Cluster** action and a **Setup Wizard** so new users never hit a dead end.
## Troubleshooting
Hard-refresh the page. If it still doesn't load, check the browser console for errors and reach out to support.
The feed shows deployments from the **last 5 days**. If your org has been quiet longer than that, the feed will be empty — this is expected. Click any service in **Your Workloads** to see its full deployment history.
The cluster agent can't reach Skyhook. Click the card to open the cluster detail page, then check the agent status. Common causes: the agent pod isn't running, outbound connectivity is blocked, or the connector chart needs an upgrade.