> ## Documentation Index
> Fetch the complete documentation index at: https://docs.skyhook.io/llms.txt
> Use this file to discover all available pages before exploring further.
# Observability Bundle
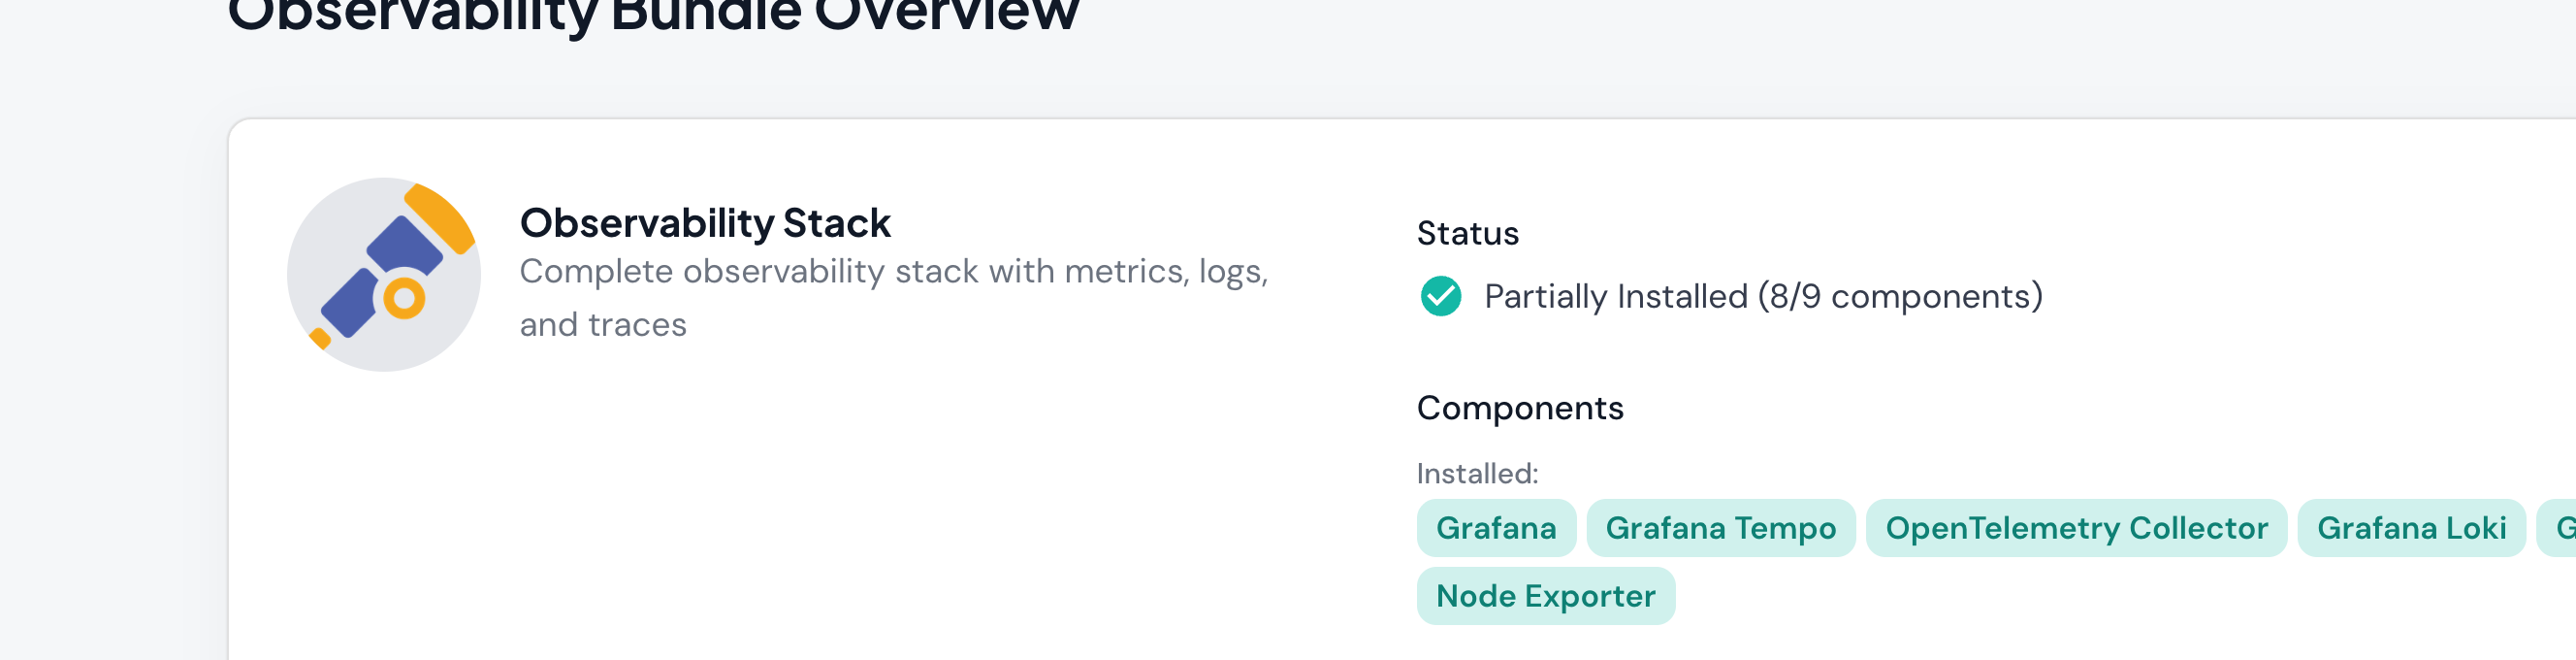
> Complete observability stack with metrics, logs, and traces for Kubernetes clusters
## What is the Observability Bundle?
The Observability Bundle is a curated collection of industry-standard tools that provide comprehensive monitoring, logging, and tracing for your Kubernetes clusters. Skyhook manages the installation and configuration of these tools through GitOps workflows, giving you a complete observability solution with minimal setup effort.
 The bundle implements the three pillars of observability:
* **Metrics**: Numerical measurements of system performance over time (CPU usage, request rates, error rates)
* **Logs**: Text records of discrete events that occurred in your system
* **Traces**: Records of requests as they flow through distributed services
## Bundle Components
The Observability Bundle includes 9 integrated components that work together to provide complete visibility into your Kubernetes infrastructure and applications.
### Visualization and Dashboards
Central dashboard for visualizing metrics, logs, and traces. Grafana connects to all other components in the bundle to provide unified observability dashboards.
* Multi-datasource support (Prometheus, Loki, Tempo, Mimir)
* Pre-built dashboards for Kubernetes monitoring
* Custom dashboard creation
* Alerting and notifications
### Distributed Tracing
High-volume distributed tracing backend for storing and querying traces from your applications.
* Cost-effective trace storage (object storage backend)
* Integrates with Grafana for trace visualization
* Compatible with OpenTelemetry, Jaeger, and Zipkin
* Search traces by service, duration, tags
Vendor-neutral telemetry collection agent that receives, processes, and exports traces, metrics, and logs.
* Deployment mode: Collector (aggregation)
* Receives telemetry from applications
* Routes data to Tempo, Loki, and other backends
* Protocol support: OTLP, Jaeger, Zipkin
Node-level OpenTelemetry collector running as a DaemonSet (one pod per node).
* Deployment mode: DaemonSet (per-node)
* Collects node and pod-level telemetry
* Lower network overhead for local collection
* Forwards to central collector or backends
### Log Aggregation
Log aggregation system designed for efficiency and ease of use, inspired by Prometheus.
* Cost-effective log storage (indexes metadata, not content)
* LogQL query language (similar to PromQL)
* Integrates seamlessly with Grafana
* Label-based log filtering and search
### Metrics Collection and Storage
Industry-standard metrics collection and time-series database for Kubernetes.
* Automatic service discovery in Kubernetes
* PromQL query language
* Pull-based metrics collection
* Short-term metrics storage (15-30 days typical)
Long-term metrics storage backend compatible with Prometheus.
* Horizontally scalable metrics storage
* Long-term retention (months to years)
* Prometheus remote write compatible
* Multi-tenancy support
Generates metrics about Kubernetes object states (deployments, pods, nodes, etc.).
* Cluster-level resource metrics
* Object state and health information
* Deployment status, pod status, node conditions
* Scraped by Prometheus
Exports hardware and OS-level metrics from Kubernetes nodes.
* CPU, memory, disk, network metrics
* Runs as DaemonSet (one per node)
* System-level performance data
* Node health monitoring
## How Components Work Together
The observability bundle components integrate to provide end-to-end visibility:
```
Application
├─> OpenTelemetry SDK (instrumented code)
│ ├─> Traces ────────────> OTel Collector ────────> Grafana Tempo
│ ├─> Logs ──────────────> OTel Collector ────────> Grafana Loki
│ └─> Metrics ───────────> OTel Collector ────────> Prometheus/Mimir
│
Kubernetes Cluster
├─> Prometheus ──────────────> Scrapes metrics from:
│ ├─> Kube State Metrics (cluster objects)
│ ├─> Node Exporter (node resources)
│ └─> Application /metrics endpoints
│ └─> Remote Write ────────> Grafana Mimir (long-term storage)
│
└─> Grafana ─────────────────> Visualizes data from:
├─> Prometheus (real-time metrics)
├─> Mimir (historical metrics)
├─> Loki (logs)
└─> Tempo (traces)
```
## Installation
The Observability Bundle is installed and managed through Skyhook's GitOps integration using ArgoCD.
### Prerequisites
* ArgoCD installed and configured (see [GitOps Setup](/infrastructure/gitops/overview))
* At least one Kubernetes cluster connected to Skyhook
* Management cluster identified (where observability backends will run)
### Installing the Bundle
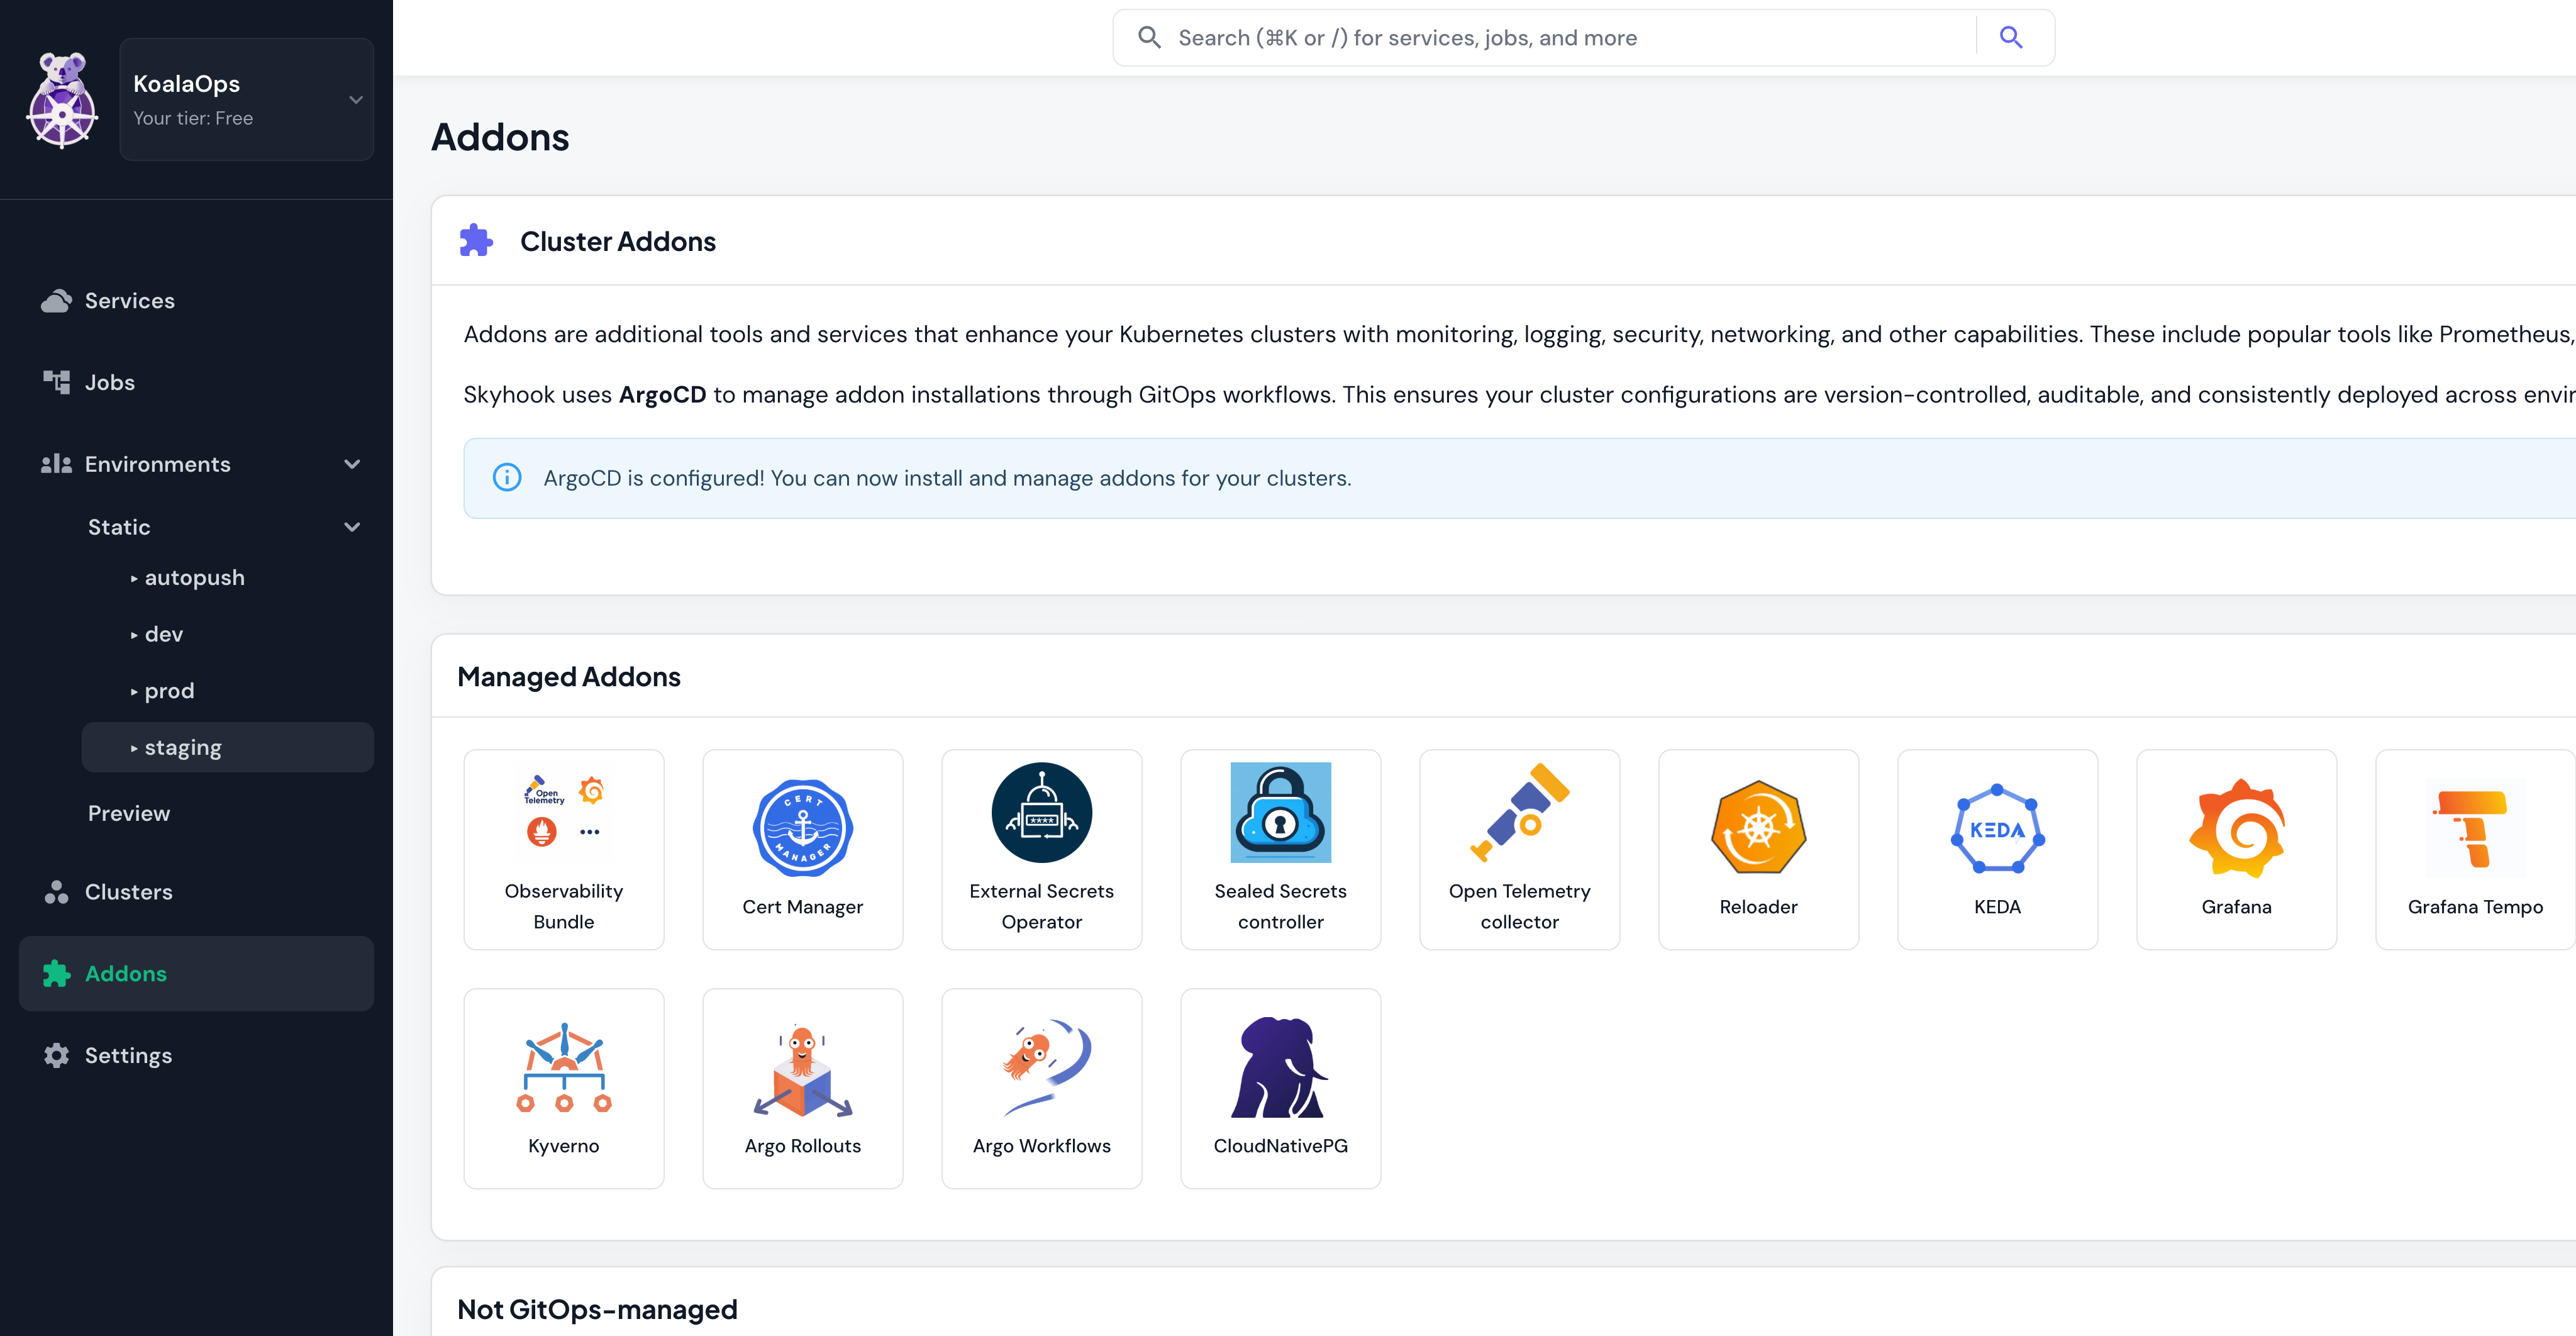
1. Navigate to **Addons** in the Skyhook dashboard
2. Click on **Observability Bundle**
3. Click **Configure** to set up the bundle
The bundle implements the three pillars of observability:
* **Metrics**: Numerical measurements of system performance over time (CPU usage, request rates, error rates)
* **Logs**: Text records of discrete events that occurred in your system
* **Traces**: Records of requests as they flow through distributed services
## Bundle Components
The Observability Bundle includes 9 integrated components that work together to provide complete visibility into your Kubernetes infrastructure and applications.
### Visualization and Dashboards
Central dashboard for visualizing metrics, logs, and traces. Grafana connects to all other components in the bundle to provide unified observability dashboards.
* Multi-datasource support (Prometheus, Loki, Tempo, Mimir)
* Pre-built dashboards for Kubernetes monitoring
* Custom dashboard creation
* Alerting and notifications
### Distributed Tracing
High-volume distributed tracing backend for storing and querying traces from your applications.
* Cost-effective trace storage (object storage backend)
* Integrates with Grafana for trace visualization
* Compatible with OpenTelemetry, Jaeger, and Zipkin
* Search traces by service, duration, tags
Vendor-neutral telemetry collection agent that receives, processes, and exports traces, metrics, and logs.
* Deployment mode: Collector (aggregation)
* Receives telemetry from applications
* Routes data to Tempo, Loki, and other backends
* Protocol support: OTLP, Jaeger, Zipkin
Node-level OpenTelemetry collector running as a DaemonSet (one pod per node).
* Deployment mode: DaemonSet (per-node)
* Collects node and pod-level telemetry
* Lower network overhead for local collection
* Forwards to central collector or backends
### Log Aggregation
Log aggregation system designed for efficiency and ease of use, inspired by Prometheus.
* Cost-effective log storage (indexes metadata, not content)
* LogQL query language (similar to PromQL)
* Integrates seamlessly with Grafana
* Label-based log filtering and search
### Metrics Collection and Storage
Industry-standard metrics collection and time-series database for Kubernetes.
* Automatic service discovery in Kubernetes
* PromQL query language
* Pull-based metrics collection
* Short-term metrics storage (15-30 days typical)
Long-term metrics storage backend compatible with Prometheus.
* Horizontally scalable metrics storage
* Long-term retention (months to years)
* Prometheus remote write compatible
* Multi-tenancy support
Generates metrics about Kubernetes object states (deployments, pods, nodes, etc.).
* Cluster-level resource metrics
* Object state and health information
* Deployment status, pod status, node conditions
* Scraped by Prometheus
Exports hardware and OS-level metrics from Kubernetes nodes.
* CPU, memory, disk, network metrics
* Runs as DaemonSet (one per node)
* System-level performance data
* Node health monitoring
## How Components Work Together
The observability bundle components integrate to provide end-to-end visibility:
```
Application
├─> OpenTelemetry SDK (instrumented code)
│ ├─> Traces ────────────> OTel Collector ────────> Grafana Tempo
│ ├─> Logs ──────────────> OTel Collector ────────> Grafana Loki
│ └─> Metrics ───────────> OTel Collector ────────> Prometheus/Mimir
│
Kubernetes Cluster
├─> Prometheus ──────────────> Scrapes metrics from:
│ ├─> Kube State Metrics (cluster objects)
│ ├─> Node Exporter (node resources)
│ └─> Application /metrics endpoints
│ └─> Remote Write ────────> Grafana Mimir (long-term storage)
│
└─> Grafana ─────────────────> Visualizes data from:
├─> Prometheus (real-time metrics)
├─> Mimir (historical metrics)
├─> Loki (logs)
└─> Tempo (traces)
```
## Installation
The Observability Bundle is installed and managed through Skyhook's GitOps integration using ArgoCD.
### Prerequisites
* ArgoCD installed and configured (see [GitOps Setup](/infrastructure/gitops/overview))
* At least one Kubernetes cluster connected to Skyhook
* Management cluster identified (where observability backends will run)
### Installing the Bundle
1. Navigate to **Addons** in the Skyhook dashboard
2. Click on **Observability Bundle**
3. Click **Configure** to set up the bundle
 The configuration wizard guides you through:
* Selecting management and workload clusters
* Configuring storage settings
* Setting up ingress for Grafana and OpenTelemetry
* Managing secrets (Grafana credentials, authentication tokens)
### Architecture Patterns
**Management Cluster**: Runs the observability backends
* Grafana (visualization)
* Tempo (trace storage)
* Loki (log storage)
* Mimir (metrics storage)
* Prometheus (metrics collection)
**Workload Clusters**: Run data collection agents
* OpenTelemetry Collector (send traces/logs to management cluster)
* Prometheus (scrape local metrics, remote write to management cluster)
* Kube State Metrics (expose cluster metrics)
* Node Exporter (expose node metrics)
This centralized architecture allows you to monitor all your clusters from a single Grafana instance.
## Component Documentation
For detailed setup and usage of individual components:
* [Metrics](/observability/metrics) - Prometheus, Mimir, Kube State Metrics, Node Exporter
* [Logs](/observability/logs) - Grafana Loki log aggregation
* [Tracing](/observability/tracing) - Grafana Tempo and OpenTelemetry distributed tracing
## Benefits
Single pane of glass for metrics, logs, and traces across all your clusters
Infrastructure as code with version control, audit trails, and easy rollbacks
Best-of-breed open source tools used by thousands of organizations
Efficient storage and retention strategies minimize infrastructure costs
Monitor all your Kubernetes clusters from a centralized observability stack
OpenTelemetry-based collection works with any instrumented application
## Next Steps
Set up GitOps and install the Observability Bundle
Set up Prometheus and Mimir for metrics collection
Configure Loki for centralized log management
Implement tracing with Tempo and OpenTelemetry
The configuration wizard guides you through:
* Selecting management and workload clusters
* Configuring storage settings
* Setting up ingress for Grafana and OpenTelemetry
* Managing secrets (Grafana credentials, authentication tokens)
### Architecture Patterns
**Management Cluster**: Runs the observability backends
* Grafana (visualization)
* Tempo (trace storage)
* Loki (log storage)
* Mimir (metrics storage)
* Prometheus (metrics collection)
**Workload Clusters**: Run data collection agents
* OpenTelemetry Collector (send traces/logs to management cluster)
* Prometheus (scrape local metrics, remote write to management cluster)
* Kube State Metrics (expose cluster metrics)
* Node Exporter (expose node metrics)
This centralized architecture allows you to monitor all your clusters from a single Grafana instance.
## Component Documentation
For detailed setup and usage of individual components:
* [Metrics](/observability/metrics) - Prometheus, Mimir, Kube State Metrics, Node Exporter
* [Logs](/observability/logs) - Grafana Loki log aggregation
* [Tracing](/observability/tracing) - Grafana Tempo and OpenTelemetry distributed tracing
## Benefits
Single pane of glass for metrics, logs, and traces across all your clusters
Infrastructure as code with version control, audit trails, and easy rollbacks
Best-of-breed open source tools used by thousands of organizations
Efficient storage and retention strategies minimize infrastructure costs
Monitor all your Kubernetes clusters from a centralized observability stack
OpenTelemetry-based collection works with any instrumented application
## Next Steps
Set up GitOps and install the Observability Bundle
Set up Prometheus and Mimir for metrics collection
Configure Loki for centralized log management
Implement tracing with Tempo and OpenTelemetry