
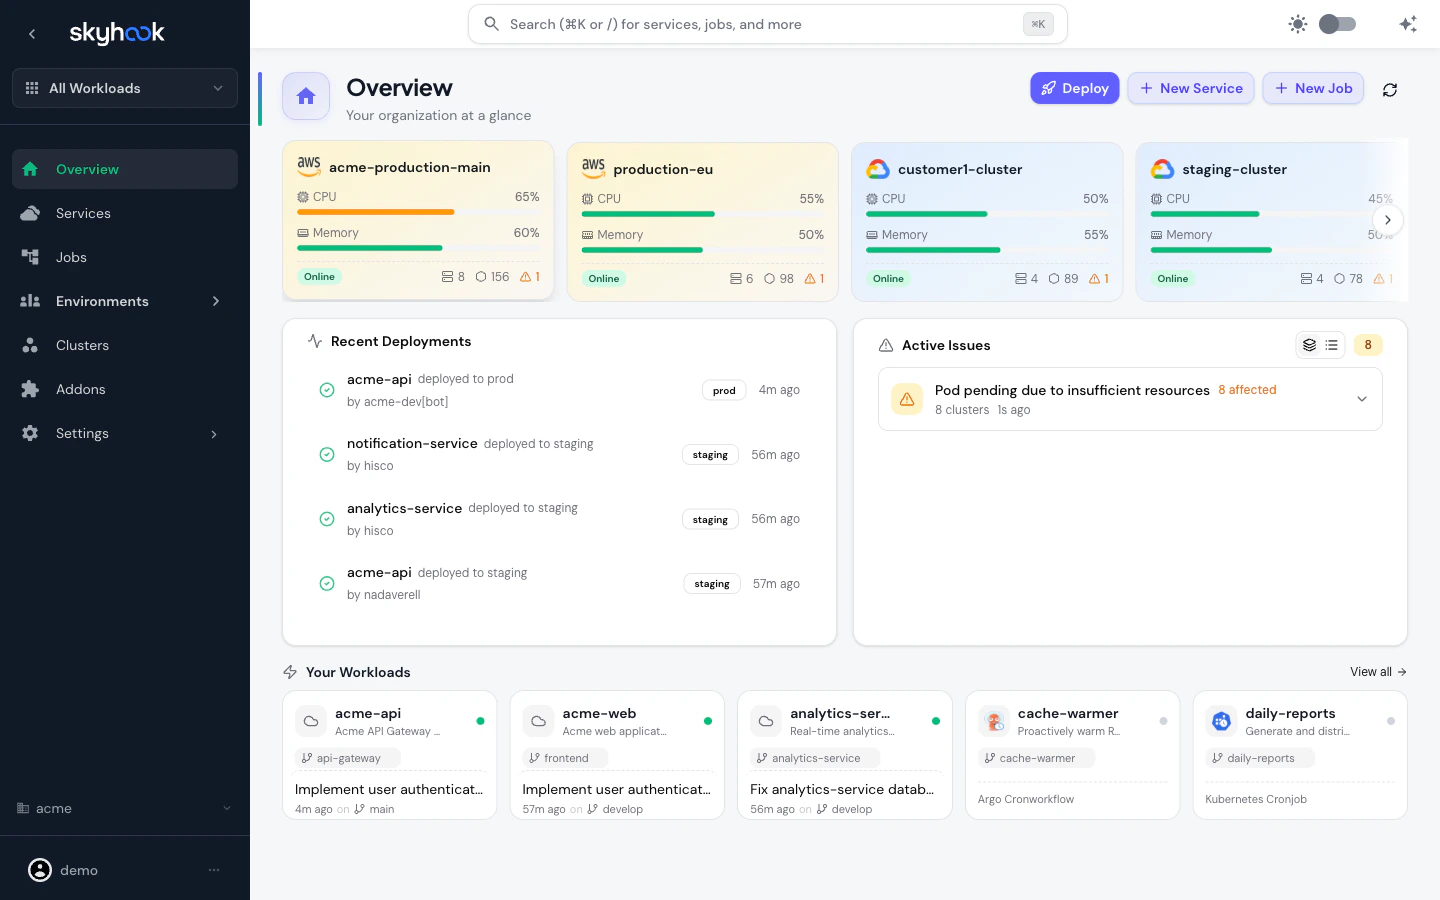
Layout
Quick actions
The top-right of the page has three buttons:- Deploy — opens the deploy dialog for any service
- New Service — opens the service creation wizard
- New Job — opens the job creation wizard
Cluster health cards
One card per connected cluster, sorted by size and arranged in a horizontally-scrollable row with fade edges. Each card shows:- Cluster name and cloud provider — color-coded for AWS, GCP, Azure so you can tell providers apart at a glance
- CPU and memory utilization (percent of total cluster capacity in use)
- Node count and pod count
- Status — Online, Inactive, Error, or Configured
- Issues — hover to see active issues affecting the cluster, with direct links to the resources
Recent Deployments
A live feed of the most recent deployments across every service in the org, not just one. Each row shows:- Service name
- Target environment
- Who deployed it
- Time ago
Active Issues
Surfaces cluster-level problems that need attention. Two view modes:- Grouped view — one row per issue type, showing how many clusters are affected and which specific resources. Each group expands to reveal the full list.
- Flat view — one row per affected resource, with a rich hover tooltip showing full details.
- Pods pending due to insufficient resources
- ImagePullBackOff / CrashLoopBackOff
- Node conditions (MemoryPressure, DiskPressure, PIDPressure)
- Persistent volume claims that can’t bind
Your Workloads
A grid of the services and jobs in your org, with a View all link to the full list. Each card shows the workload name, a description, the type (api-gateway, frontend, argo cronworkflow, kubernetes cronjob, etc.), and the most recent commit message and time.Onboarding experience (new orgs)
The home dashboard adapts to your setup state so new users always know what to do next:Zero clusters connected
Zero clusters connected
The dashboard is replaced with a Welcome to Skyhook experience that offers a Connect Cluster button and a guided Setup Wizard. Quick action buttons (Deploy, New Service, New Job) are hidden because they wouldn’t do anything useful yet.
Clusters connected but no services
Clusters connected but no services
The cluster health and active issues sections work as normal. The Your Workloads section shows an Add a service to Skyhook card pointing to the create/import flow, and the recent activity feed shows a friendly No recent activity message with a pointer toward deploying your first service.
Setup checklist on other pages
Setup checklist on other pages
Services, Jobs, Clusters, Environments, Addons, and FinOps all show a setup checklist when critical prerequisites are missing, rather than empty or broken states. Each one offers a Connect Cluster action and a Setup Wizard so new users never hit a dead end.
Troubleshooting
Home dashboard stuck on loading
Home dashboard stuck on loading
Hard-refresh the page. If it still doesn’t load, check the browser console for errors and reach out to support.
Recent activity feed is empty
Recent activity feed is empty
The feed shows deployments from the last 5 days. If your org has been quiet longer than that, the feed will be empty — this is expected. Click any service in Your Workloads to see its full deployment history.
Cluster card shows Error status
Cluster card shows Error status
The cluster agent can’t reach Skyhook. Click the card to open the cluster detail page, then check the agent status. Common causes: the agent pod isn’t running, outbound connectivity is blocked, or the connector chart needs an upgrade.