
- Organization-wide (Settings → Production Readiness) — enable the feature, configure which checks apply, add custom checks, and see an aggregate score distribution across all services.
- Per-service (service → Production Readiness tab) — see the service’s score, what’s failing, and how to fix it, with a breakdown by category.
Enabling Production Readiness
Readiness is off by default. An org owner enables it by selecting which environments and services to monitor.1
Open Settings → Production Readiness
Navigate to Settings > Production Readiness. If readiness hasn’t been enabled yet, you’ll see an Enable Production Readiness card.
2
Select environments and services
Click Get Started to open the Environment Selection dialog.
- Pick one or more environments to monitor. Ephemeral (preview) environments are filtered out — readiness only applies to static environments.
- For each environment, either toggle Select all services or pick specific services.
3
Enable
Click Enable to activate readiness checks for the selected service/environment pairs. Scores start populating as Skyhook evaluates each service.
4
Add more later
Once enabled, the settings page shows an Add Environments button in the top-right to extend coverage to additional environments or services. Existing selections are pre-populated so you only add what’s new.
Organization overview
The settings page gives you a top-level view of readiness across your org:- Org Score — a weighted average of all evaluated services, shown as a large percentage with a visual score ring.
- Service compliance distribution — how many services fall into each bucket:
- Excellent (80–100%) — green
- Good (60–79%) — amber
- Needs Work (< 60%) — red
- Unconfigured — services with no checks enabled or with evaluation errors
- Checklist table — every check in your org, with filters for category, importance, and recommended-only, plus a search box. Toggle checks on/off here without touching individual services.
Per-service view
Each service has a Production Readiness tab that shows how it’s doing in a selected environment.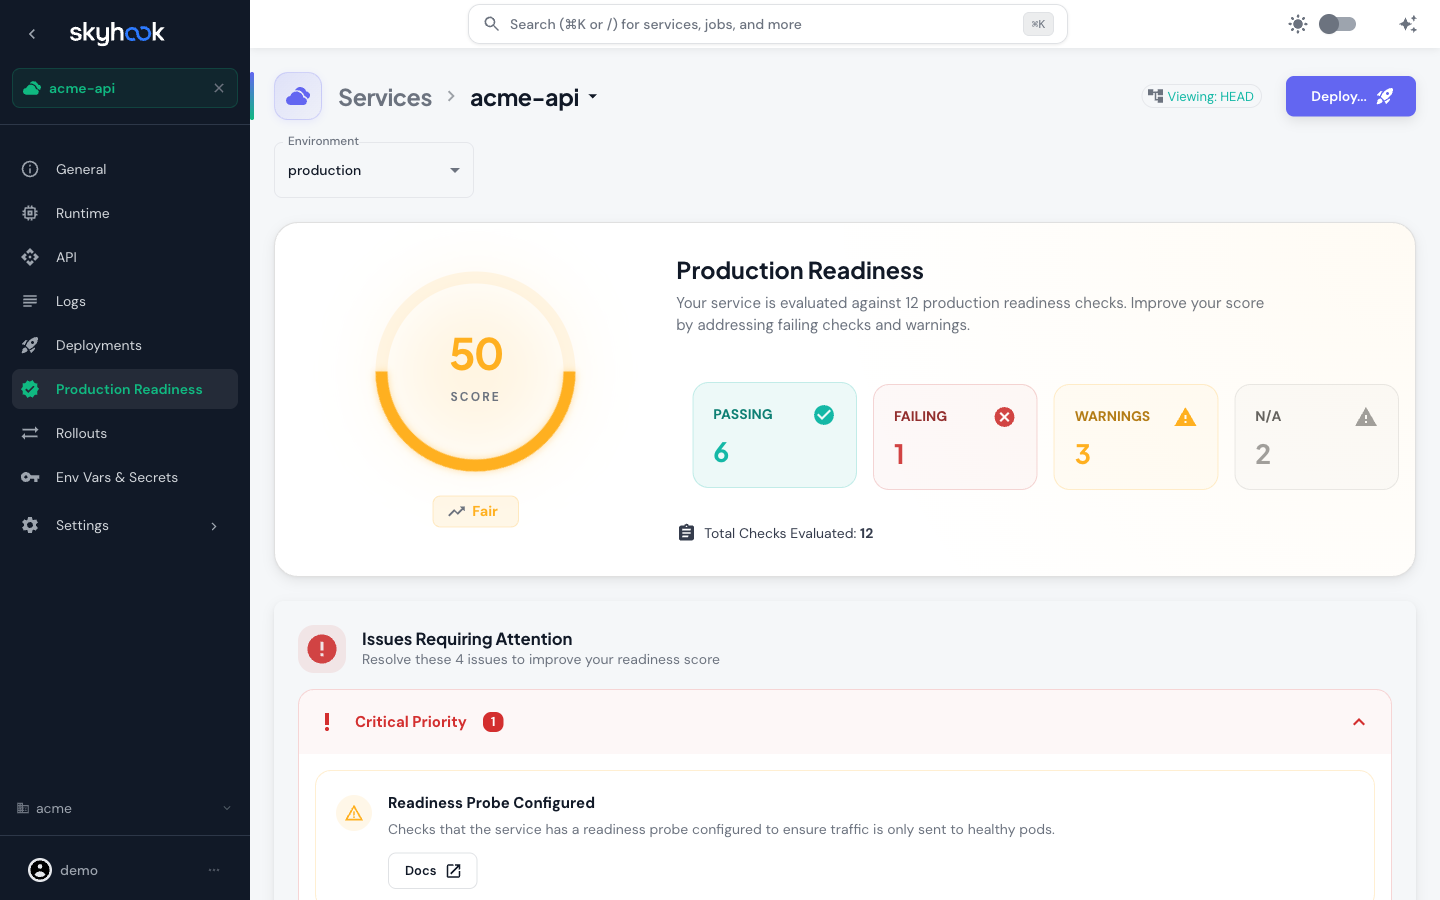
Score card
- Score — 0–100, computed from passing checks weighted by importance. Labeled as Excellent, Good, Fair, or Needs Work.
- Environment selector — switch between monitored environments for this service.
- Status counts — how many checks are PASSING, FAILING, in WARNING state, or N/A (not applicable to this workload).
Issues Requiring Attention
Surfaces failing and warning checks grouped by importance — Critical, High, Medium, Low — so you fix the most important things first. Each item shows:- The check title and description
- A Docs link to the relevant documentation
- A Fix action where Skyhook knows how to resolve the issue — this often deep-links into the deployment configuration with the right field highlighted
All Checks
A category-grouped accordion showing every check that applies to the service. Each category (e.g. Reliability, Performance & Testing, Security, Best Practices, Custom Checks) shows a pass rate and count.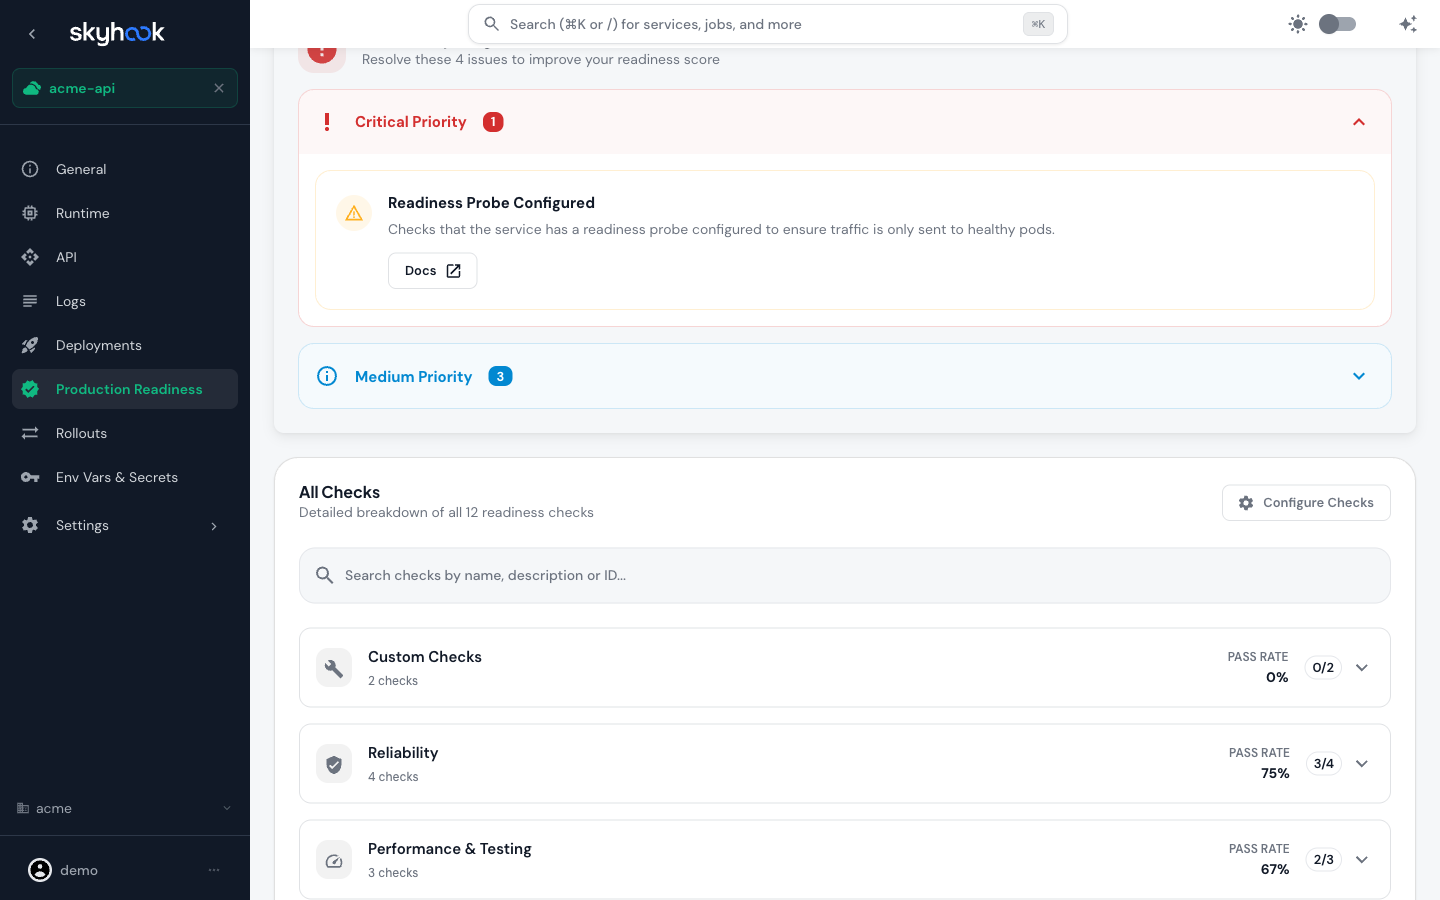
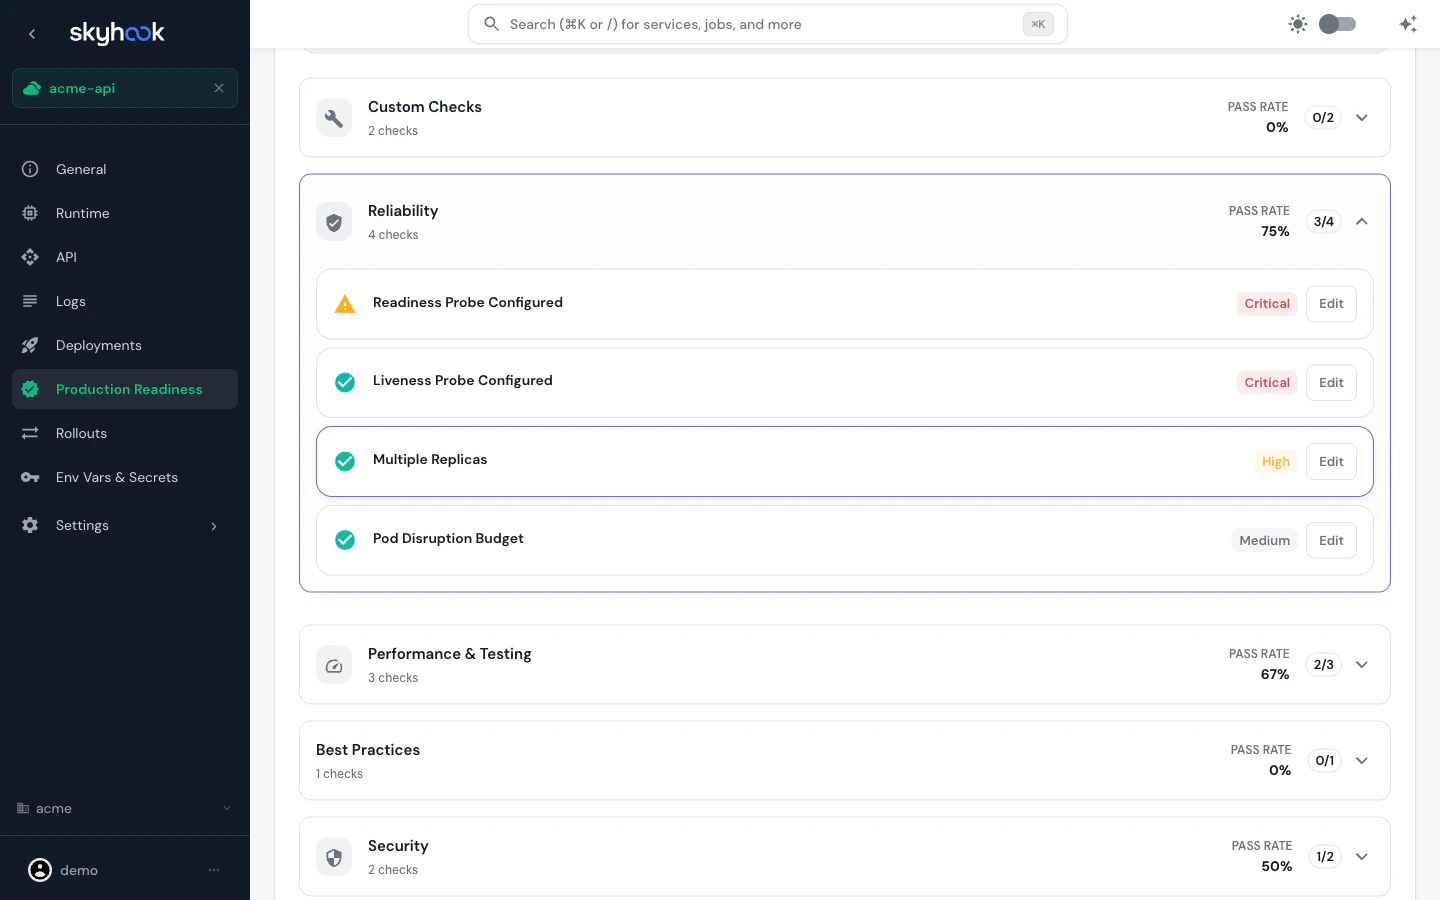
Status reference
Custom checks
Beyond the built-in checklist, organizations can author custom checks that match their own standards. Custom checks appear alongside the built-in ones in the service view and count toward the score.1
Open the custom check dialog
On the Settings > Production Readiness page, click Configure Checks and then Create Custom Check (top-right of the checklist table).
2
Define the check
Fill in:
- Name and Description — what the check represents
- Importance — Critical, High, Medium, or Low (drives sort order and weight)
- Apply to — All services or Select services (picks specific services)
- Recommended — flag the check as a recommended best practice
- Initial status — what to report before anyone resolves it (defaults to N/A)
- Failure reason — text shown to users when the check fails
- Suggested fix — free-form guidance shown alongside the failure
3
Save
Custom checks are editable and deletable from the checklist table. Deletions require confirmation.
Custom checks with
Apply type = All automatically apply to every newly created service. Checks with Apply type = Select services only apply to services you explicitly pick.How scoring works
- Each enabled check has an importance level (Critical, High, Medium, or Low) that determines how much it counts toward the score.
- The service score is the percentage of passing checks, weighted by importance. Warnings partially penalize the score; N/A checks don’t count for or against.
- The org score is the average of all service scores across all monitored environments.
- A service with no enabled checks, or whose evaluation errored, is counted as Unconfigured — it doesn’t pull the org score down.
Troubleshooting
'No readiness data' on the service tab
'No readiness data' on the service tab
The service isn’t enrolled in readiness monitoring. Open Settings > Production Readiness, click Add Environments, and add this service + environment pair.
A check I expected to fail shows as N/A
A check I expected to fail shows as N/A
N/A means the check does not apply to this workload. For example, a StatefulSet-only check won’t run against a Deployment. Check the category and description to confirm the check is intended for this workload type.
Enforcing checks in CI
Enforcing checks in CI
Readiness is visibility-focused today — it tracks and reports, but does not block deployments. For hard enforcement, combine a Kyverno policy (see Policies) with the readiness checklist so non-compliant configuration is caught at admission time.