
Prerequisites
- At least one connected cluster (see Connecting Clusters)
- The OpenCost addon installed on the clusters you want to monitor
Installing the OpenCost addon
FinOps in Skyhook is delivered as a single addon that installs both OpenCost and Prometheus:- Prometheus — collects metrics from your cluster and containers so efficiency calculations have accurate usage data
- OpenCost — joins that usage data with pricing (either estimated or from your cloud bill) to produce cost numbers
1
Open the OpenCost addon
Navigate to Addons in the sidebar and find OpenCost in the catalog, or follow the Go to Addon button from the FinOps empty state.
2
Enable OpenCost on clusters
On the OpenCost addon page, click Add next to each cluster where you want cost monitoring.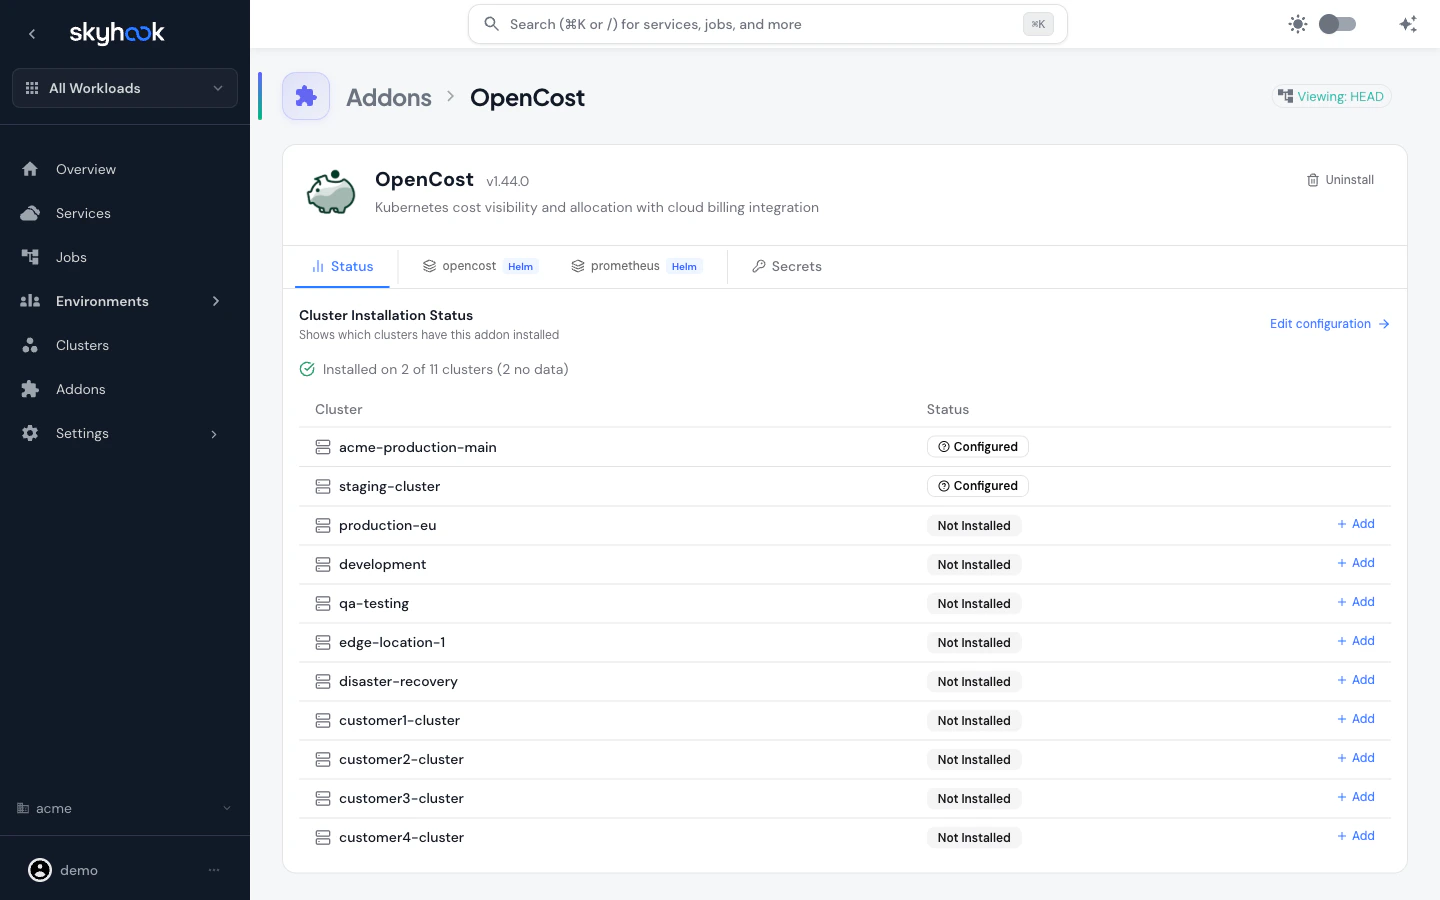
3
Cloud billing integration (optional)
Skyhook automatically detects the cloud provider for each cluster and pre-fills cloud-specific configuration:
- AWS — IRSA role annotation, Athena CUR integration (database, table, workgroup)
- GCP — Workload Identity annotation, BigQuery billing export integration
- Generic/other — Basic Prometheus metrics only (no cloud billing numbers)
4
Wait for data
After the addon syncs via ArgoCD, OpenCost needs a few minutes to start reporting metrics. Once data is available, the FinOps pages populate automatically.
FinOps costs shown in Skyhook are estimates derived from resource usage rates. Live cloud billing integration is available via the AWS/GCP configuration above — hover over the info icon next to the page title to see the current estimation status.
Summary dashboard
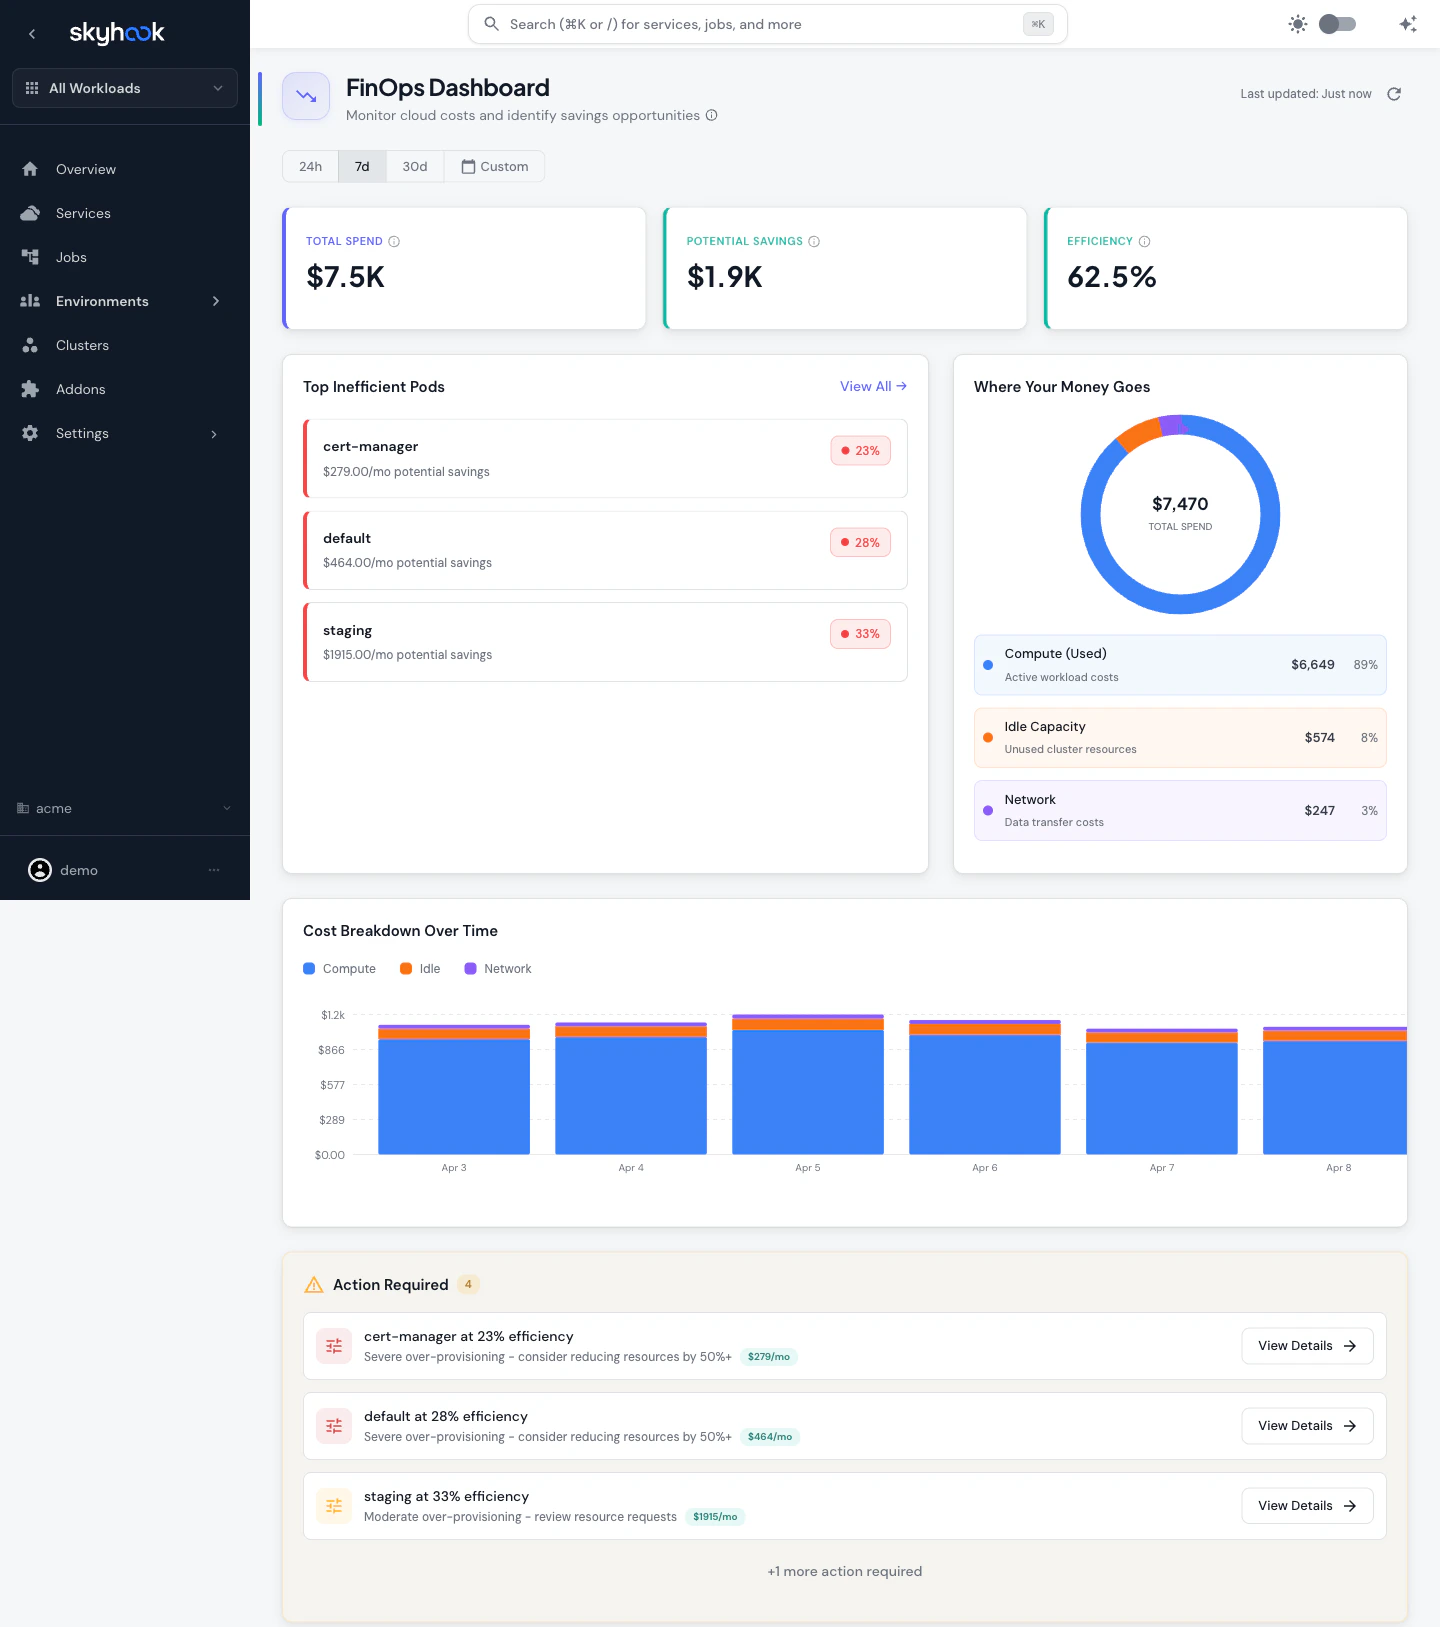
The main FinOps page (FinOps > Overview) summarizes cost and efficiency across all clusters where OpenCost is installed.Key metrics
Three headline cards at the top:- Total Spend — Sum of Kubernetes resource costs: compute (CPU + memory requests), idle capacity, and network transfer, over the selected time range.
- Potential Savings — Estimated cost reduction from right-sizing over-provisioned workloads. Calculated as requested resources minus actual usage.
- Efficiency — Ratio of actual resource usage to requested resources, weighted by cost and averaged across all workloads. Color-coded:
- Green ≥ 60% (healthy)
- Orange 30–60% (over-provisioned)
- Red < 30% (severely over-provisioned)
Top Inefficient Pods
Lists the five workloads with the worst efficiency (< 60%) and the monthly savings opportunity for each. Clicking View All jumps to the Efficiency Analysis page pre-filtered to those pods.Where Your Money Goes
Donut chart breaking total spend into three categories:- Compute (Used) — active workload cost
- Idle Capacity — unused cluster resources (node headroom, unallocated pods)
- Network — data transfer cost across zones, regions, and internet egress
Cost Breakdown Over Time
Stacked bar chart of daily or weekly cost, colored by compute/idle/network. Use the time range selector (24h, 7d, 30d, or custom) to change the window — chart buckets resize automatically (7 daily buckets for 7d, 4 weekly buckets for 30d, etc.).Action Required
Contextual list of recommended actions derived from the data:- Efficiency actions for the three worst-performing workloads, linking directly to the pod in the Efficiency page
- Idle capacity actions when idle percentage exceeds 10%, suggesting right-sizing or workload consolidation
Efficiency Analysis
The FinOps > Efficiency page shows resource utilization for every workload, with an interactive table to find over-provisioning at any level.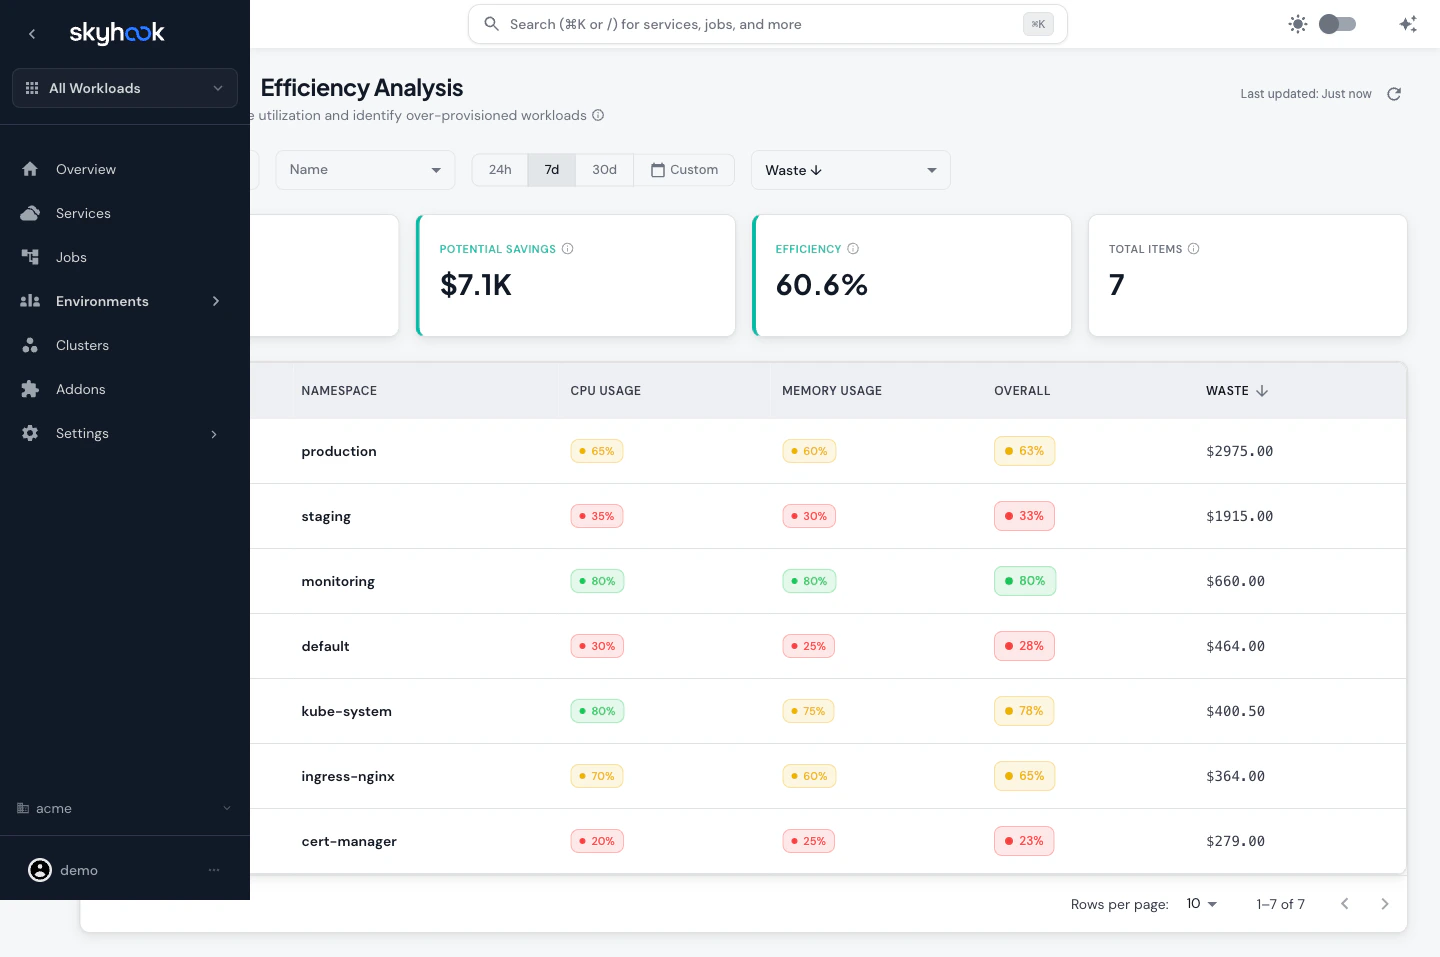
Aggregation
Switch the Aggregate dropdown to group by:- Namespace (default)
- Controller (Deployment, StatefulSet, etc.)
- Pod
- Node — adds a Machine type column cross-referenced from cluster data
Columns
Click any column header to sort. Use the Name filter box for multi-select filtering across the current aggregation.
A warning icon (⚠️) flags workloads with severely over-provisioned resources.
Expandable rows
Expand a namespace or controller row to see its child workloads with their individual CPU/memory utilization and inline Apply / Dismiss recommendations where Skyhook can suggest right-sized requests.Network Costs
The FinOps > Network Costs page breaks down data transfer spend that often hides in cloud bills.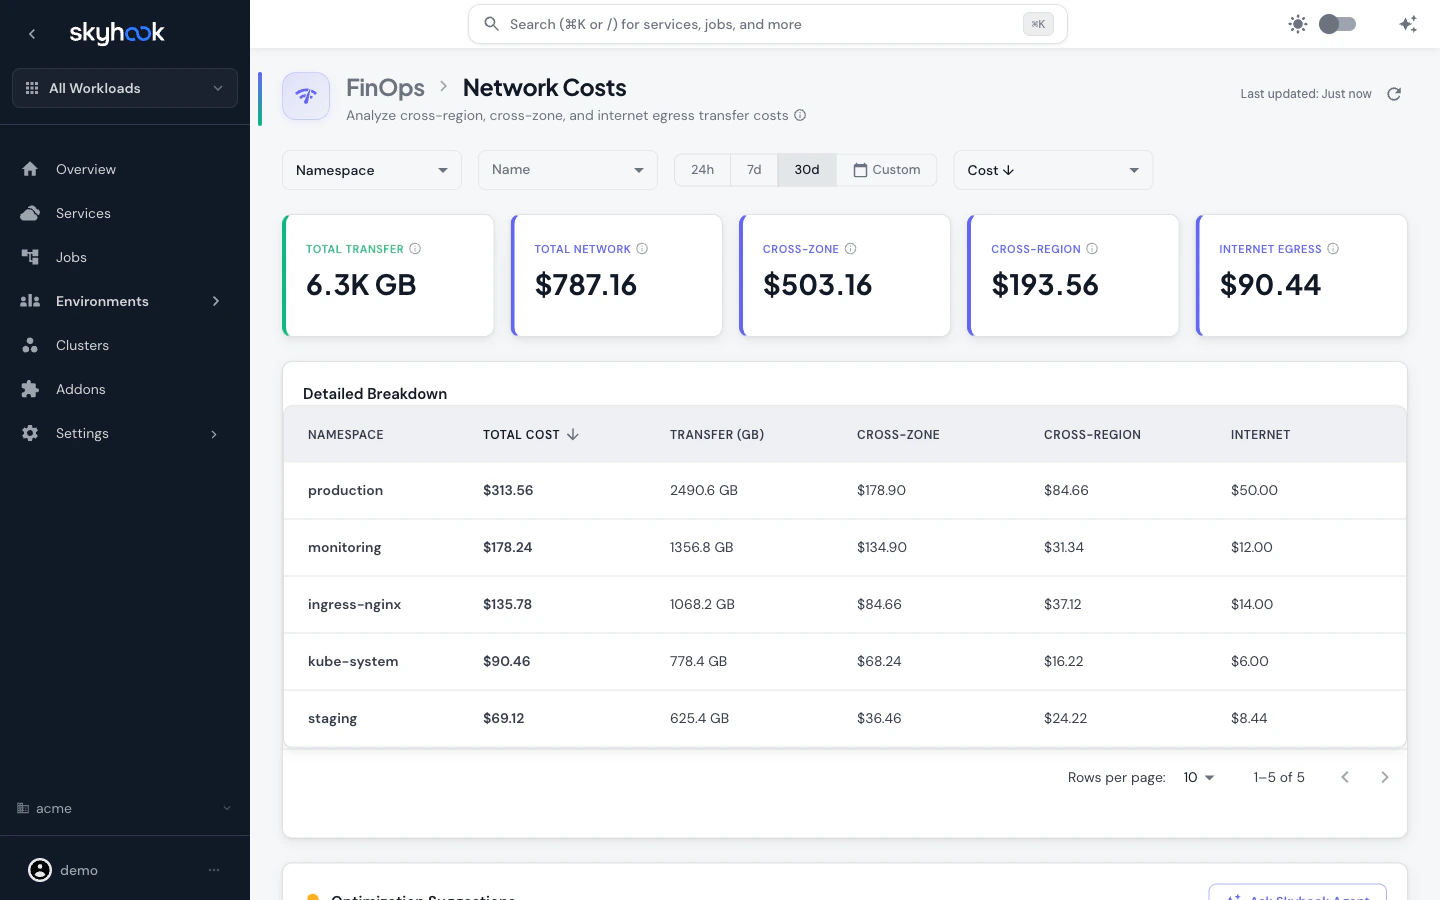
Top-line metrics
- Total Transfer — Total data moved across the network in GB
- Total Network — Total network spend
- Cross-Zone — Transfer between availability zones in the same region (usually the largest line item)
- Cross-Region — Transfer between regions
- Internet Egress — Transfer leaving the cloud provider’s network
Detailed Breakdown
Table with per-namespace (or per-controller, or per-cluster) cost and GB transferred, split across cross-zone, cross-region, and internet egress columns. Click any column header to sort.Optimization Suggestions
Skyhook generates contextual suggestions based on the breakdown — for example:- High cross-zone traffic in a namespace → consider pod affinity rules or topology-aware routing
- Cross-region traffic → co-locate services or use regional caching
- Internet egress → review external API calls for caching opportunities
Time range and refresh
Every FinOps page shares a time range selector (24h / 7d / 30d / Custom) and a refresh button. Each cluster is queried independently, so if one cluster’s OpenCost instance is unreachable, the dashboard shows partial results with a warning banner naming the failed clusters. A Last updated timestamp next to the refresh button shows data freshness. The 7-day window is loaded in the background on page open, so switching between time ranges feels instant.Troubleshooting
FinOps pages show 'Install OpenCost to Enable FinOps'
FinOps pages show 'Install OpenCost to Enable FinOps'
The OpenCost addon is not installed on any connected cluster. Click Go to Addon to open the OpenCost configuration page and add it to at least one cluster. After the addon syncs via ArgoCD, click Refresh on the FinOps page.
'Data from cluster-X could not be loaded'
'Data from cluster-X could not be loaded'
Skyhook couldn’t reach OpenCost on one or more clusters. The dashboard still shows partial results from the remaining clusters. Common causes:
- OpenCost pod is not running — check Cluster resources for the
opencostnamespace - ArgoCD sync is in progress — verify addon status on the OpenCost addon page
- Cluster agent connectivity issue — check the cluster health in Infrastructure > Clusters
Cost numbers look lower than my cloud bill
Cost numbers look lower than my cloud bill
Without cloud billing integration, Skyhook estimates costs from resource usage rates and standard instance pricing. These are useful for relative comparisons (which workload wastes the most?) but won’t match a cloud bill to the cent.For accurate numbers, configure the AWS Athena CUR integration or GCP BigQuery billing export in the OpenCost addon. The info icon next to the page title shows the current estimation status.
Efficiency shows > 100% for a workload
Efficiency shows > 100% for a workload
A workload using more resources than requested is underprovisioned — it’s being throttled or risks OOM-kill. Skyhook flags these alongside over-provisioned workloads so you can raise the requests instead of lowering them.