What You Can Do
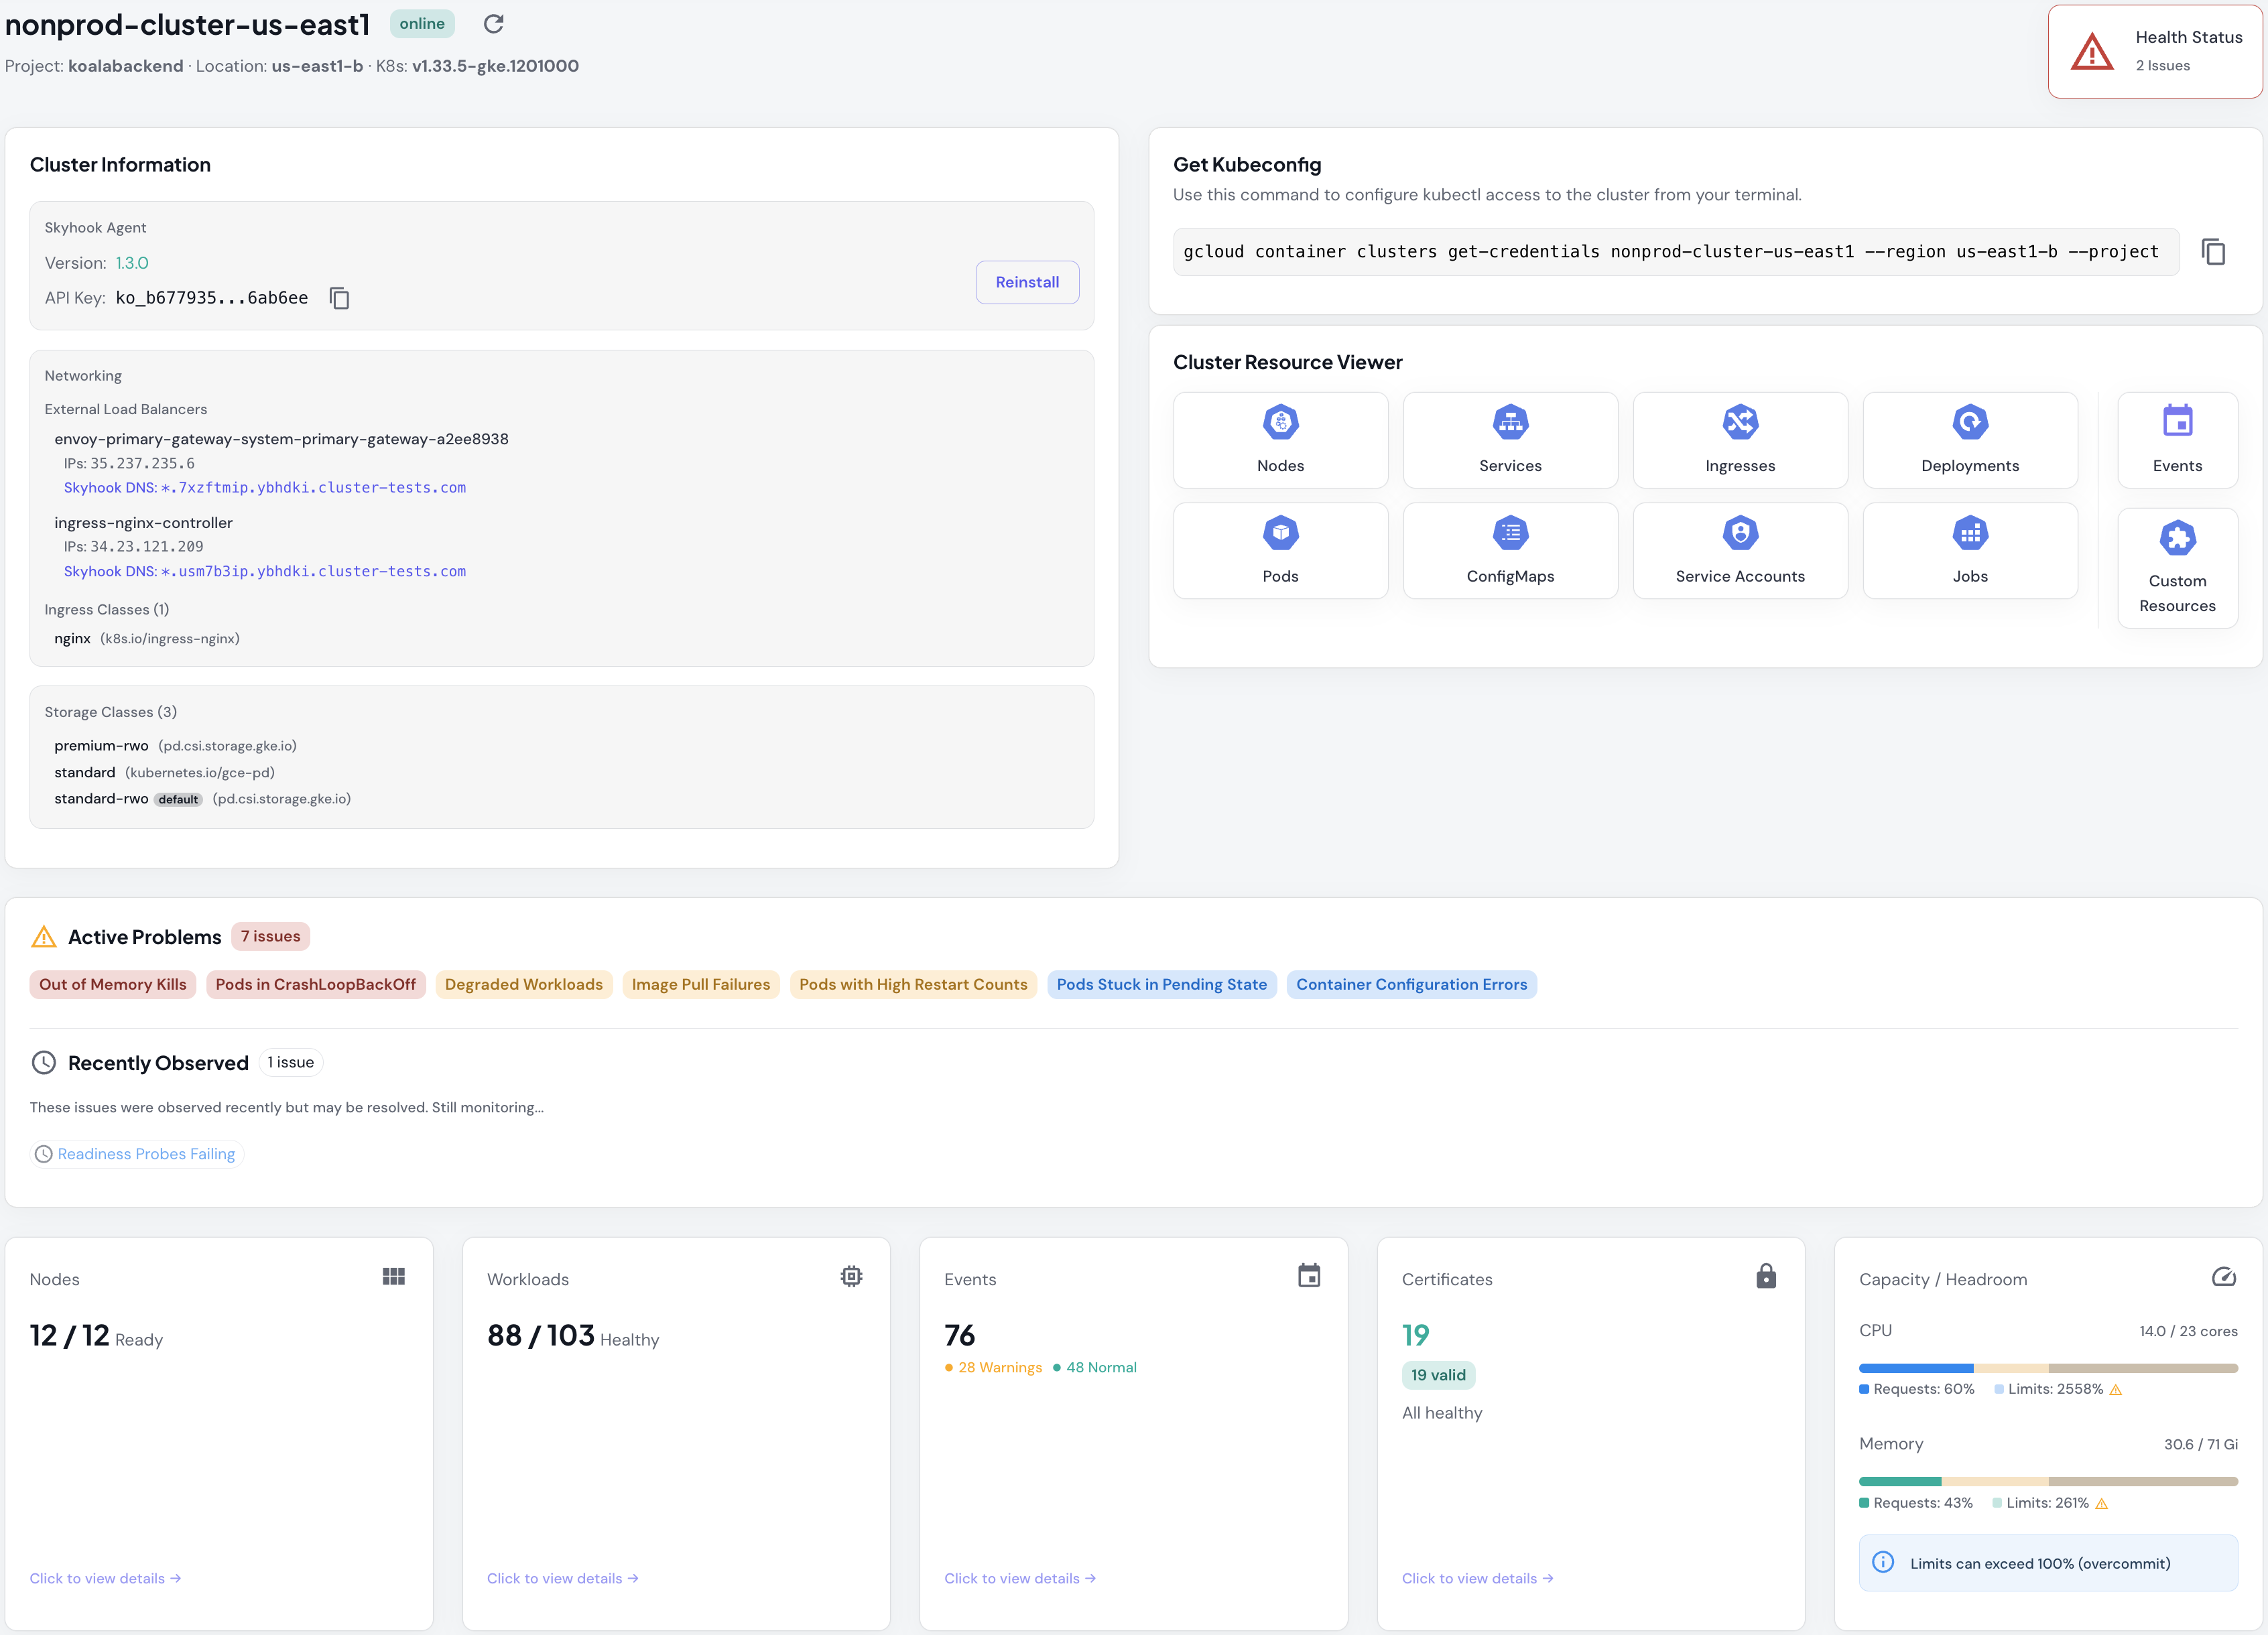
Monitor Cluster Health
Track real-time cluster metrics with automatic problem detection across 18+ issue types:- Pod/Container problems: CrashLoopBackOff, OOMKilled, ImagePullBackOff, high restart counts
- Workload health: Degraded deployments, StatefulSets with unavailable replicas
- Node conditions: Memory pressure, disk pressure, unschedulable nodes
- Configuration issues: Container config errors, failed volume mounts
- Resource capacity: CPU/memory requests vs limits with visual progress bars and overcommit warnings
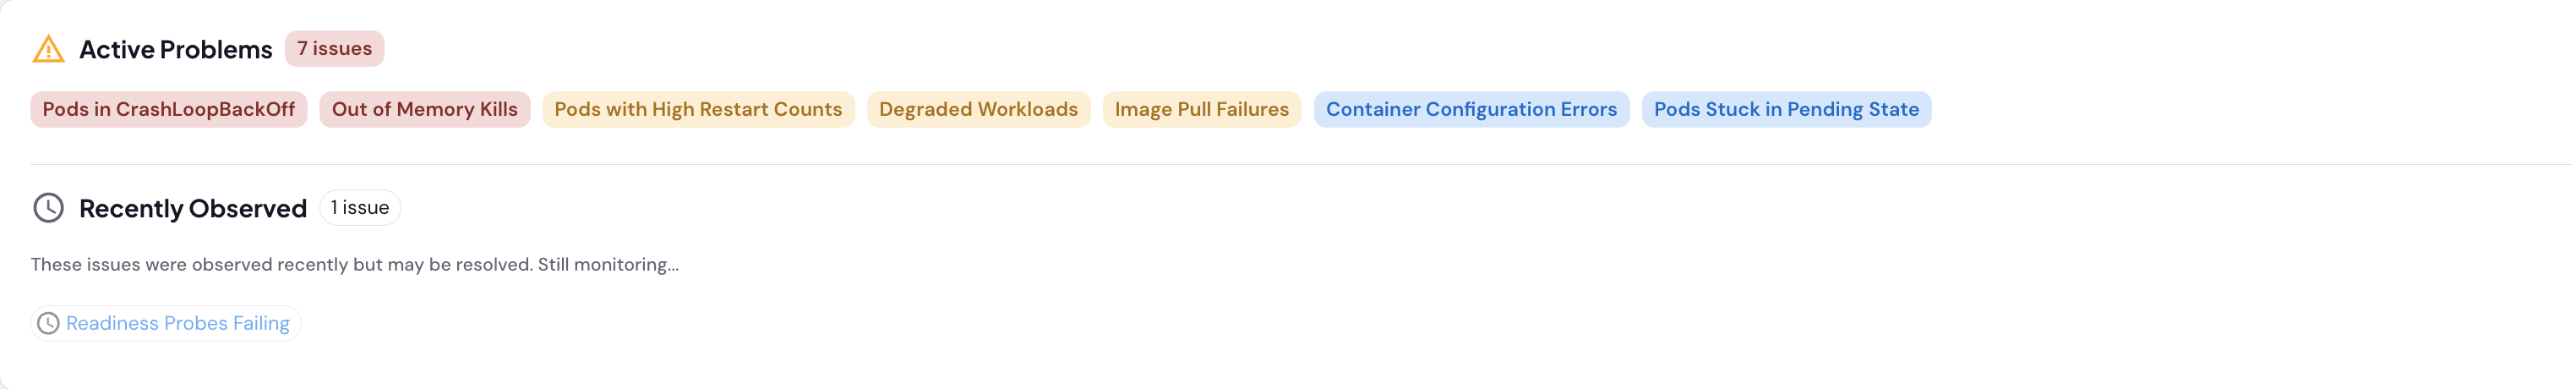
Detect and Troubleshoot Problems
View active problems across your clusters with detailed context. Each problem type includes:- Severity classification: Critical, major, or minor
- Affected resource count with direct filtering to see impacted pods/workloads
- Temporal tracking: First observed, last seen, observation count, and duration
- Remediation guidance: Specific steps to resolve each issue type
Inspect Kubernetes Resources
Drill down into any resource type with rich filtering and search:- 10 resource tabs: Nodes, Services, Ingresses, Deployments, Pods, ConfigMaps, Service Accounts, Jobs, Custom Resources, Events
- Advanced filtering: By namespace, status/phase, problem type, with URL-based shareable filters
- Problem detection: Automatic detection and filtering for 14+ pod problem types
- Detail drawers: View complete specs, status conditions, and raw YAML for any resource
- Inline logs viewer: Stream pod logs with search, level filtering, and JSON prettification
Track Certificates
Monitor cert-manager certificates with comprehensive status tracking:- Expiration monitoring: Days remaining countdown with 30-day warning threshold
- Status conditions: Ready, Pending (Issuing), Error, or Unknown states
- DNS coverage: View all domains covered by each certificate
- Issuer tracking: See which ClusterIssuer or Issuer manages each certificate
- Automatic detection: No configuration needed; certificates appear automatically once cert-manager is installed
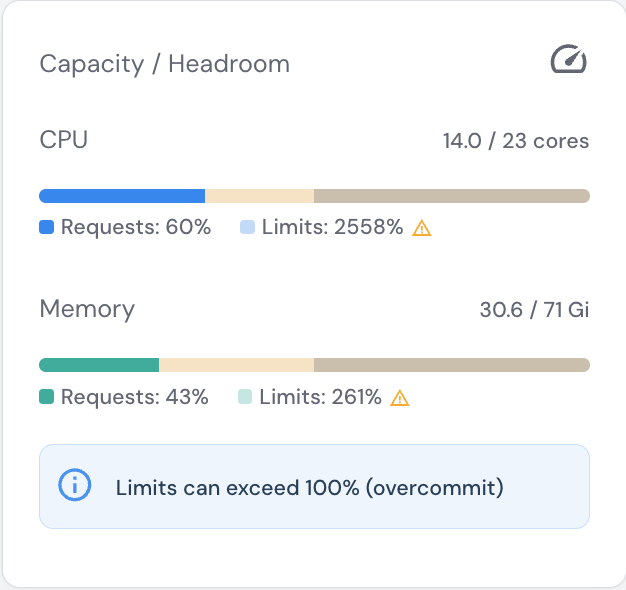
Measure Capacity and Utilization
Track resource usage with visual progress bars and namespace-level breakdowns:- Requests vs Limits: Separate bars showing guaranteed resources and maximum usage caps
- Overcommit detection: Visual warnings when limits exceed 100% of node capacity
- Namespace breakdown: See CPU/memory consumption per namespace to identify resource-heavy teams or applications
- Pod capacity: Running pods vs allocatable pod count
Supported Platforms
- Google Cloud (GKE) - Fully supported
- AWS (EKS) - Fully supported
- Azure (AKS) - Private beta (coming soon)
- Any Kubernetes - On-prem, bare-metal, OVH, DigitalOcean, Linode, k3s, and any conformant Kubernetes distribution
How It Works
Skyhook connects to your clusters via the lightweight Cluster Connector. The connector runs as a single pod in your cluster and continuously syncs cluster state to Skyhook’s backend. It’s read-only and uses Kubernetes RBAC for permissions. Once connected, you can:- View cluster health and problems in the Cluster View
- Browse all resources in the Resource Viewer
- Manage agent versions and configurations from the Clusters List
Getting Started
- Connect a Cluster - Register your cluster and install the Skyhook Connector
- View Your Clusters - See all connected clusters and their status
- Explore Cluster Health - Monitor problems and resource summaries
- Inspect Resources - Drill down into pods, services, and more
Already have clusters connected? Jump to the Clusters List to start managing them.