Accessing Cluster View
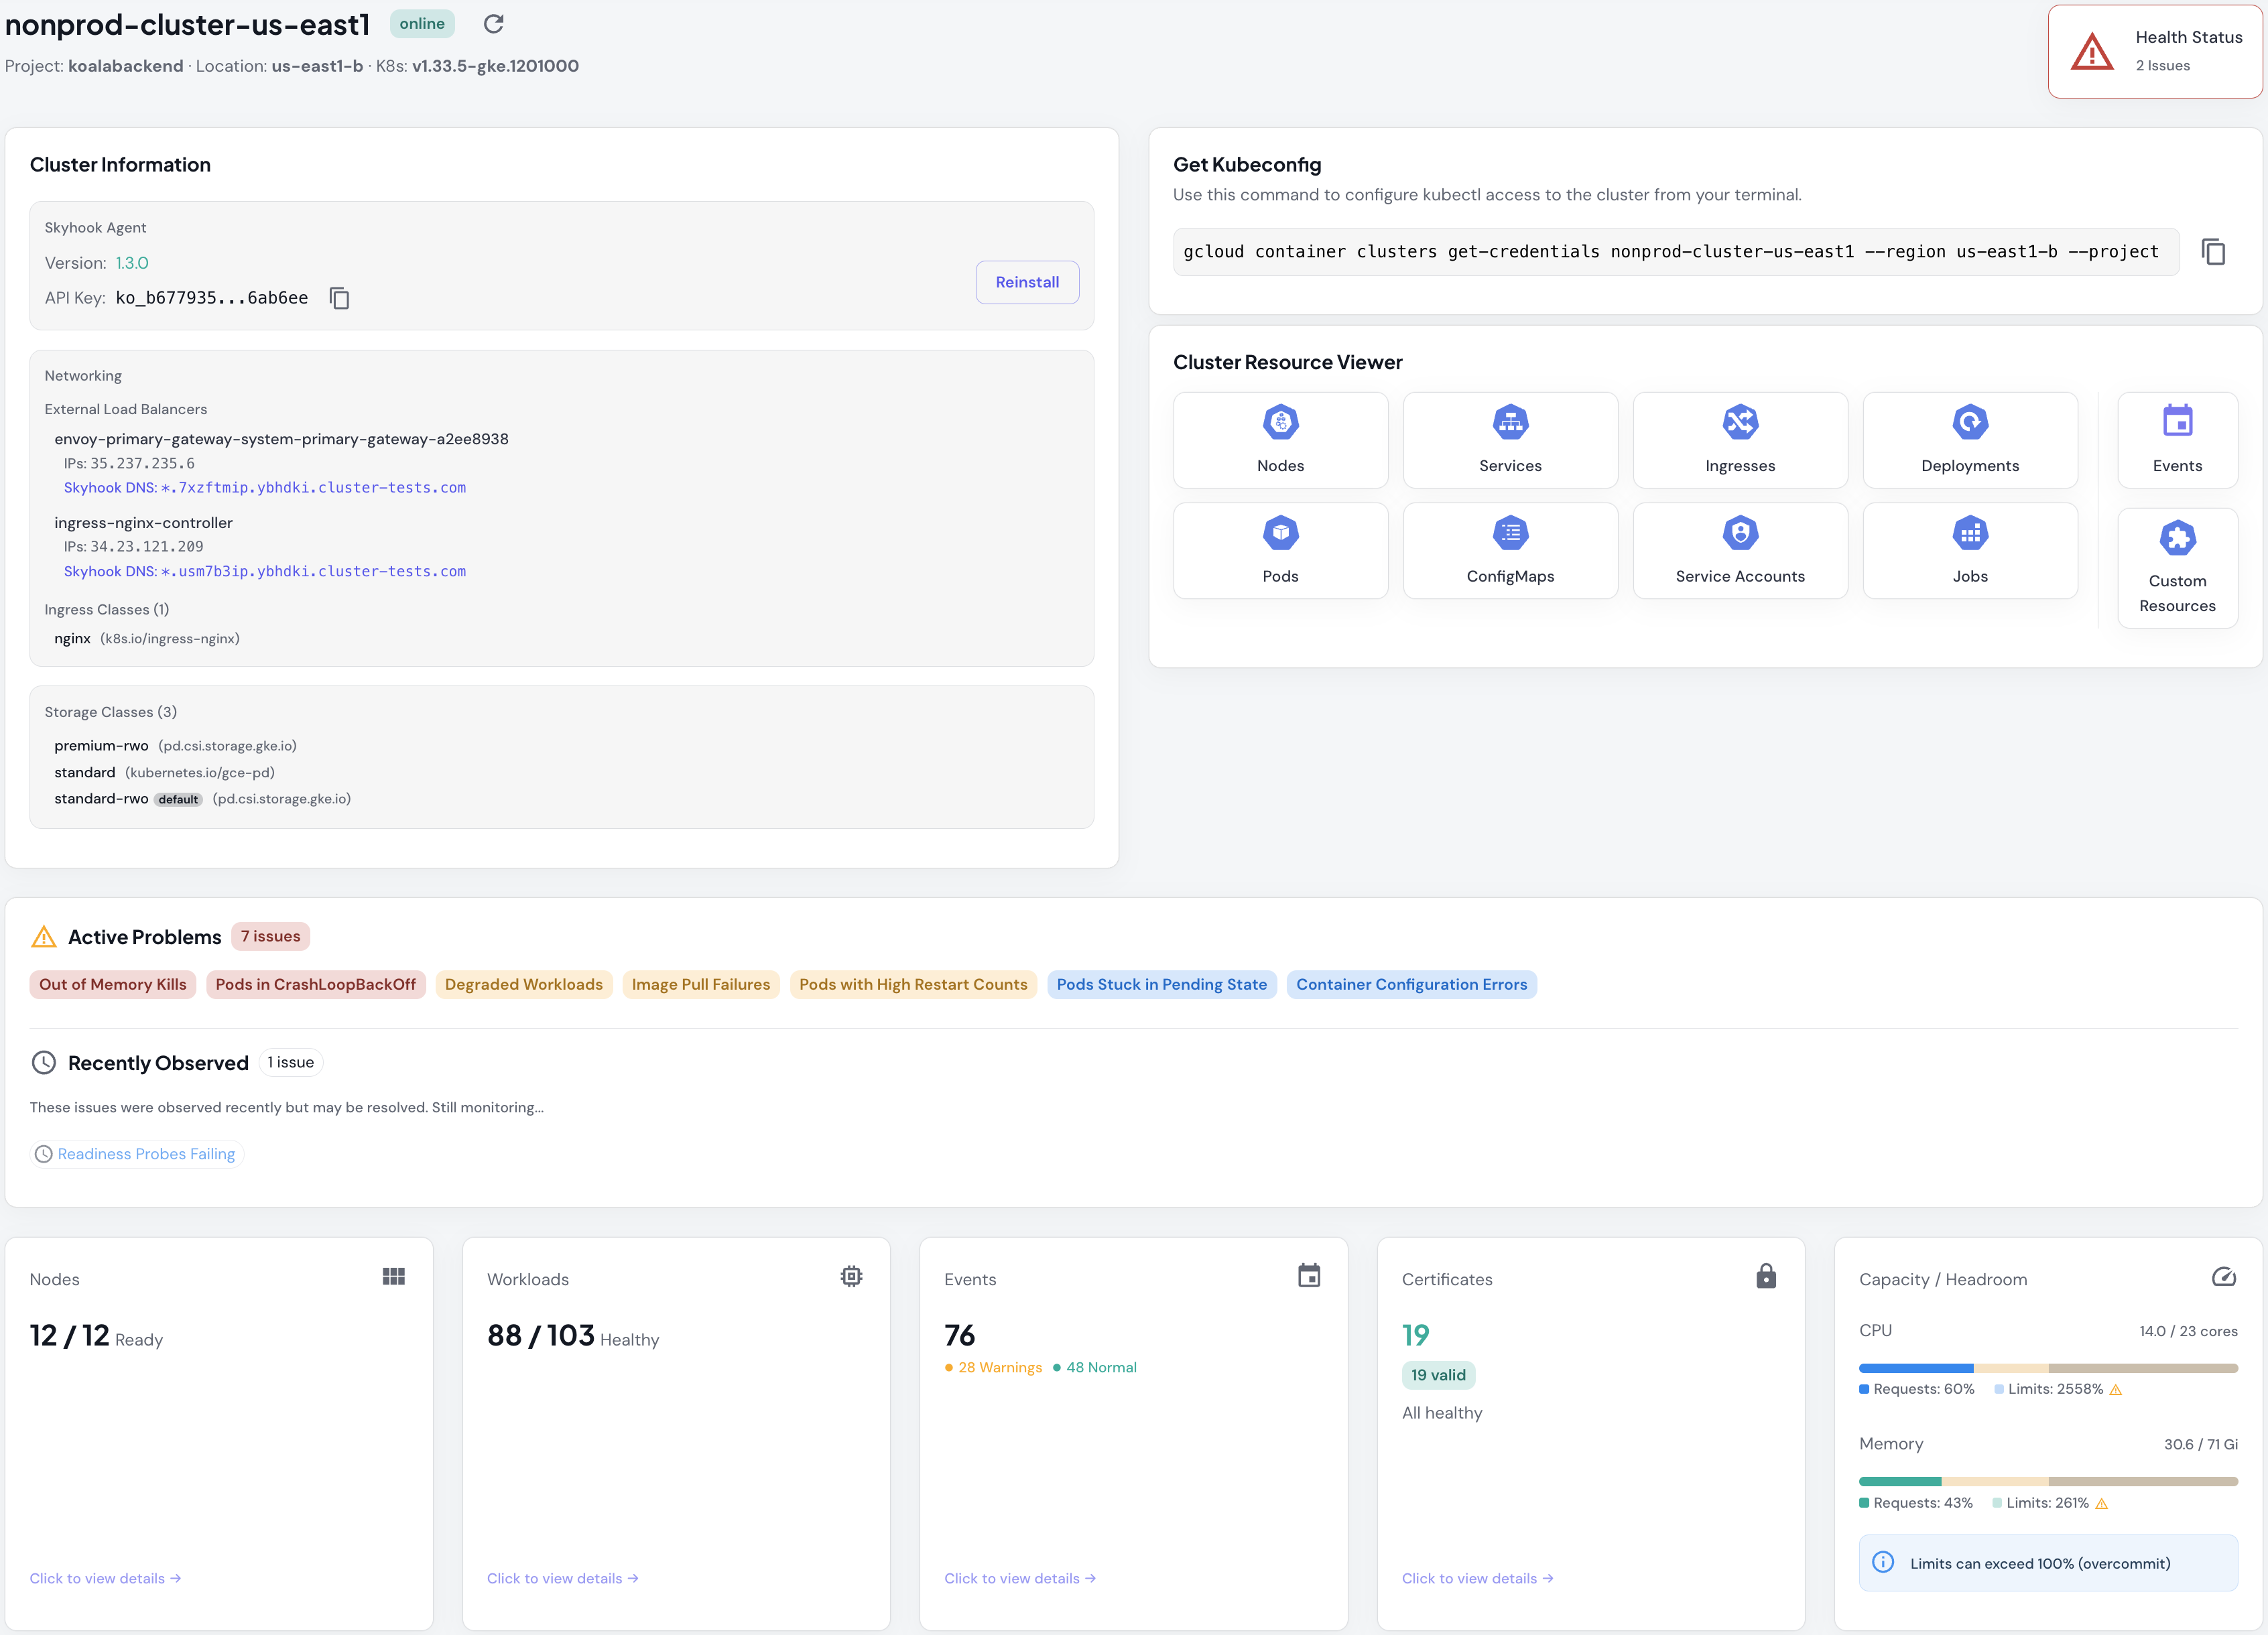
From the Clusters List, click any cluster name to open its Cluster View.Health Status
At the top of the page, you’ll see an overall health indicator showing the number of active issues detected in the cluster. Status types:- Healthy - No critical issues detected
- Warning - Non-critical issues found (e.g., pod restarts, resource pressure)
- Critical - Urgent problems requiring attention (e.g., CrashLoopBackOff, OOM kills)
Cluster Information Panel
Agent Details
- Cluster Connector Version - The version of the Cluster Connector running in this cluster
- API Key - The unique authentication key for this cluster
- Reinstall Button - Click to view the
helm upgradecommand to update the agent
Networking
Skyhook auto-assigns unique wildcard DNS (e.g.,*.7xzftmip.mct545.cluster-tests.com) to each load balancer, so you can expose services without manual DNS setup. Just point your custom domain to the load balancer IP.
The panel shows all LoadBalancer services with their external IPs, auto-generated DNS entries, and ingress classes. If you’re running multiple ingress controllers (nginx + envoy), each gets its own DNS and IP, useful for traffic splitting, canary testing, or migrating between ingress implementations.
Storage Classes
Lists available storage backends for persistent volumes (e.g.,standard-rwo, premium-rwo on GCP; gp2, gp3 on AWS). The default storage class is marked; that’s what PVCs use when you don’t specify storageClassName. Helps you understand which storage options are available when provisioning volumes.
Get Kubeconfig
Pre-filledgcloud or aws command to configure kubectl access to your cluster from your terminal. The command includes your exact cluster name, region/zone, and project/account ID. Click copy when you need to run commands the UI doesn’t support (custom kubectl plugins, helm charts, etc.).
Cluster Resource Viewer
Quick-access icons to jump directly to any resource type: Nodes, Services, Ingresses, Deployments, Pods, ConfigMaps, Service Accounts, Jobs, Custom Resources, and Events. Faster than clicking through tabs when you know what you’re looking for.Active Problems
The Active Problems panel automatically detects Kubernetes issues across your cluster with 18+ distinct problem types. Each problem is categorized by severity and includes temporal tracking.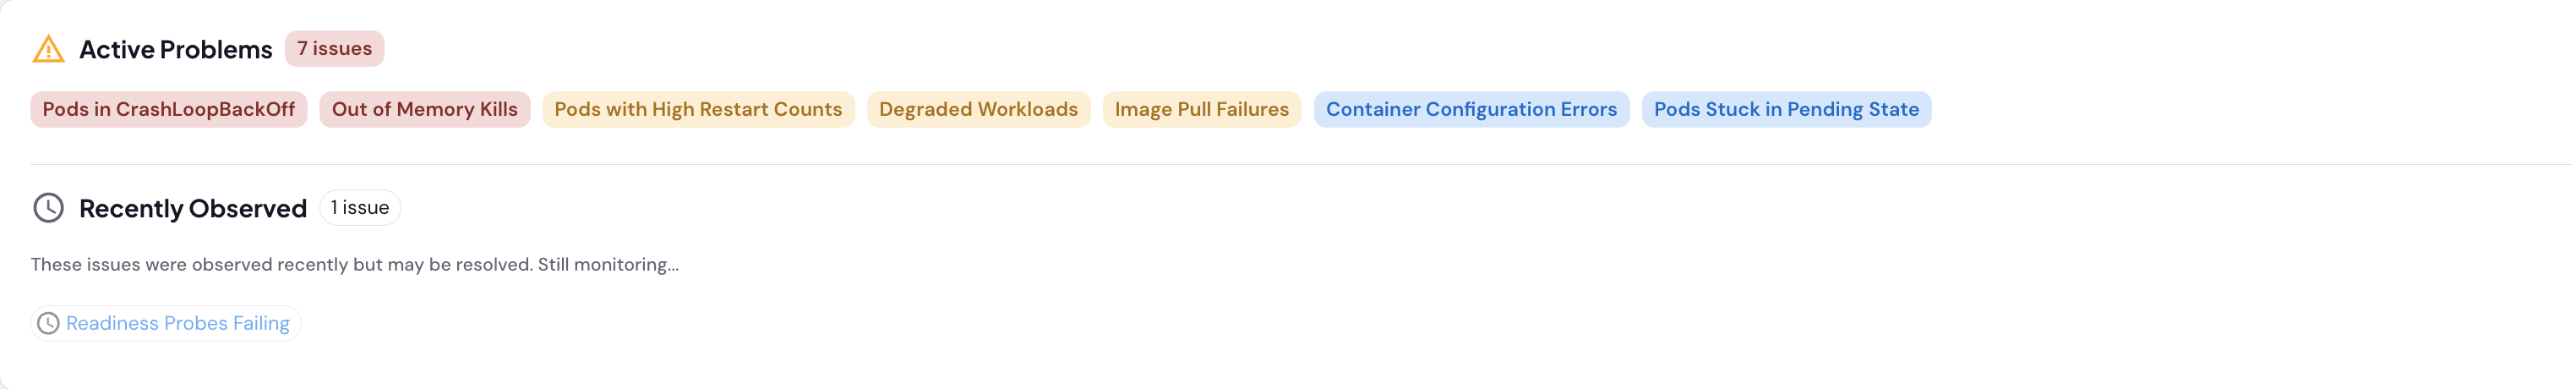
Problem Types Detected
Node Problems:- NodeNotReady (critical) - Nodes not accepting workloads
- MemoryPressure (critical) - Node running low on memory
- DiskPressure (critical) - Node running low on disk space
- PIDPressure (minor) - Node running low on process IDs
- ManyCordonedNodes (major) - Excessive nodes marked unschedulable
- CrashLoopBackOff (critical) - Pods repeatedly failing to start
- ImagePullBackOff (major) - Cannot pull container images
- OOMKilled (critical) - Containers terminated due to out-of-memory
- CreateContainerConfigError (minor) - Invalid container configuration
- LivenessProbeFailing (critical) - Liveness health checks failing
- ReadinessProbeFailing (minor) - Readiness health checks failing
- HighRestartCount (major) - Pods restarting >5 times
- PodPending (minor) - Pods stuck in Pending state
- UnschedulablePods (minor) - Pods cannot be scheduled to nodes
- ManyFailedPods (major) - Multiple pods in Failed state
- EvictedPods (major) - Pods evicted due to resource pressure
- TerminatingPodsStuck (major) - Pods stuck terminating >5 minutes
- FailedMount (minor) - Volume mount failures
- FailedAttachVolume (major) - Volume attachment failures
- DegradedWorkloads (major) - Deployments/StatefulSets with fewer ready replicas than desired
How Problem Tracking Works
Problems are tracked in two states:- Active Problems: Currently detected in your cluster’s resource state. These affect your cluster health and are shown as colored chips.
- Recently Observed: Detected in cluster events within the last 10 minutes but not currently active. These help you spot intermittent issues or auto-resolved problems.
- Severity: Critical (red), Major (orange), or Minor (yellow)
- Affected count: How many resources have this problem
- First observed / Last seen: Temporal tracking with duration
- Observation count: How many times this problem was detected
- Remediation guidance: Specific steps to fix the issue
- View Affected Resources button: Directly filters the Resource Viewer to show impacted pods/workloads
Resource Summary Cards
Quick-view cards show high-level metrics for different resource categories:Nodes
- Total Nodes - Number of nodes in the cluster
- Ready Nodes - Nodes in Ready state and accepting workloads
Workloads
- Healthy Workloads - Deployments, StatefulSets, and DaemonSets meeting their desired state
- Total Workloads - All workload resources in the cluster
- All desired replicas are ready
- No pods in CrashLoopBackOff or Error state
- All containers passing health checks
Events
- Warning Events - Events requiring attention
- Normal Events - Informational events
- Total Events - All cluster events in the last hour
Certificates
- Valid Certificates - TLS certificates that haven’t expired
- Total Certificates - All cert-manager Certificate resources
Capacity and Headroom
The capacity section shows cluster-wide resource utilization with visual progress bars and overcommit detection.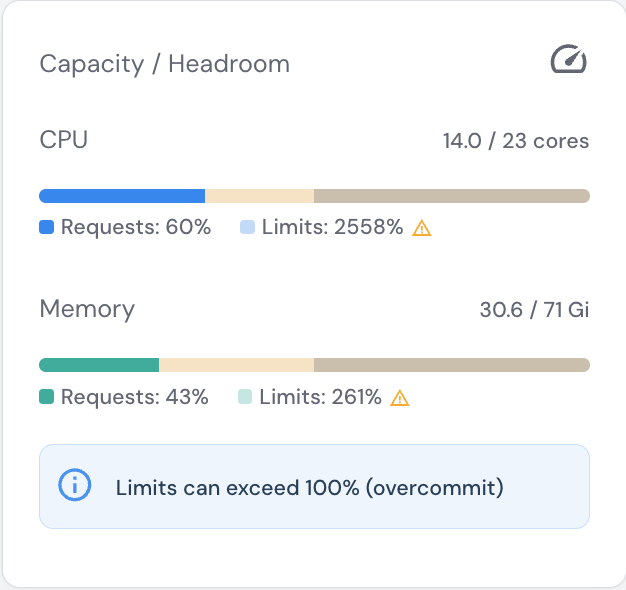
Understanding Requests vs Limits
- Requests - Guaranteed resources the cluster must provide (used for scheduling decisions)
- Limits - Maximum resources pods can consume (pods are throttled or killed if exceeded)
Reading the Metrics
Each resource shows two progress bars:- Solid bar (Requests): Guaranteed resources as % of node allocatable capacity
- Light overlay (Limits): Maximum possible usage as % of node allocatable capacity
- ✅ CPU Requests (60%): Healthy headroom for scheduling new workloads
- 🚨 CPU Limits (2558%): Severely overcommitted - if all pods hit their limits simultaneously, nodes will throttle containers
- ⚠️ Memory Requests (43%): Good utilization with room to grow
- 🚨 Memory Limits (261%): Overcommitted - pods at risk of OOMKill if memory usage spikes
Warning Events
A detailed table of recent warning events aggregated by type. The table shows the most recent issues requiring attention.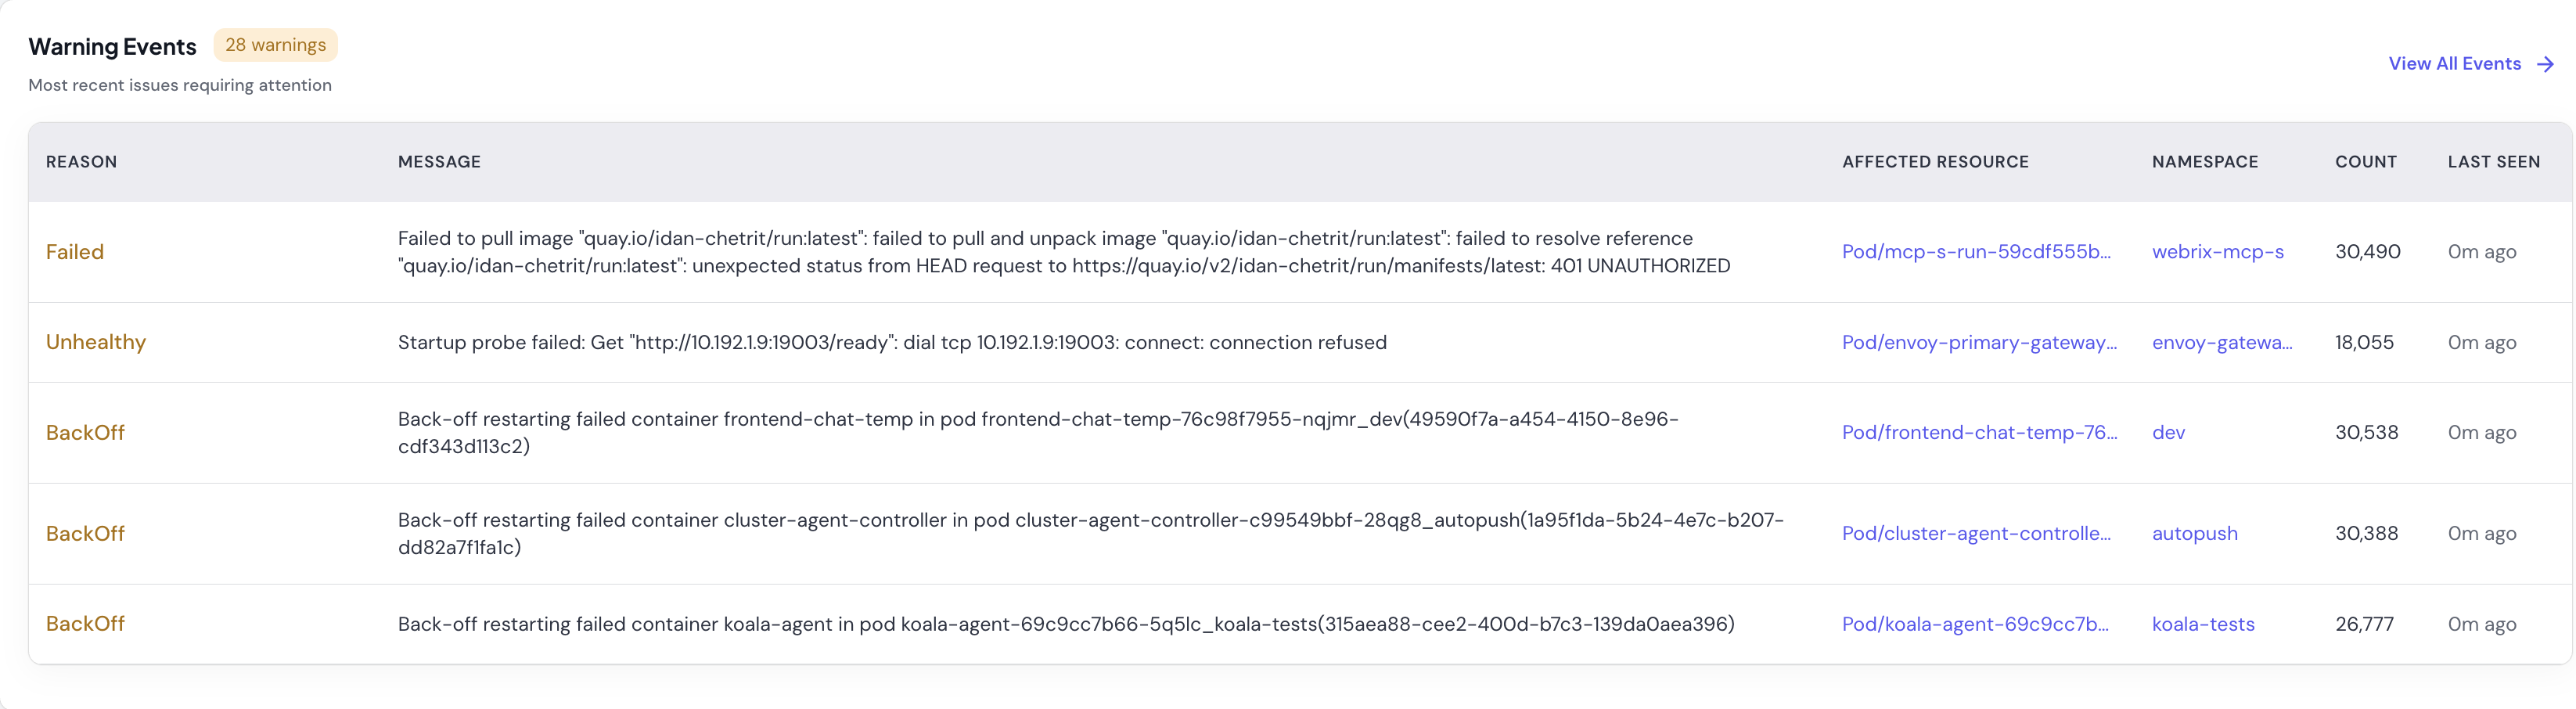
- Reason - Event classification with color coding (Failed, Unhealthy, BackOff, etc.)
- Message - Detailed event description (truncated for long messages)
- Affected Resource - The pod, deployment, or resource triggering the event (clickable link)
- Namespace - Where the event occurred
- Count - How many times this event has been observed
- Last Seen - When the event last occurred (e.g., “0m ago” for very recent events)
Resource Usage by Namespace
A breakdown of resource consumption across namespaces helps you:- Identify resource-heavy namespaces: Sort by CPU/Memory to find top consumers
- Detect overcommitment: Compare requests vs limits per namespace
- Track team resource usage: If you use namespace-per-team organization
- Plan capacity: See which namespaces need quota adjustments
- Namespace - The namespace name
- Pods - Number of running pods
- CPU (Requests / Limits) - Total requested and max CPU in cores (e.g., “4 / 12”)
- Memory (Requests / Limits) - Total requested and max memory in Gi (e.g., “8Gi / 24Gi”)
- Quota Status - ✅ Within quota or ⚠️ Over quota (if ResourceQuota defined)
Finding oversized resource requests
Finding oversized resource requests
If
production namespace shows 8 cores requested but only 5 pods running with low actual usage, you may have oversized resource requests preventing efficient scheduling.Identifying runaway workloads
Identifying runaway workloads
A namespace with 50 pods requesting 20 cores might indicate a scaling issue or resource leak, especially if replicas grew unexpectedly.
Planning capacity additions
Planning capacity additions
If multiple namespaces show high request percentages and you’re adding new services, use this data to justify adding nodes or adjusting quotas.