- Cluster Resources — a full Kubernetes resource browser, scoped to a cluster, with a categorized sidebar and detail drawer
- Cluster Topology — a live visual map of a cluster’s workloads and how they connect
- Service Runtime — a per-service view showing the service’s topology, connectivity, and Kubernetes resources in one place
kubectl would show you — no stale GitOps state, no manual refresh.
Cluster Resources browser
Navigate to Clusters → <cluster> → Resources to open the cluster-wide resource browser.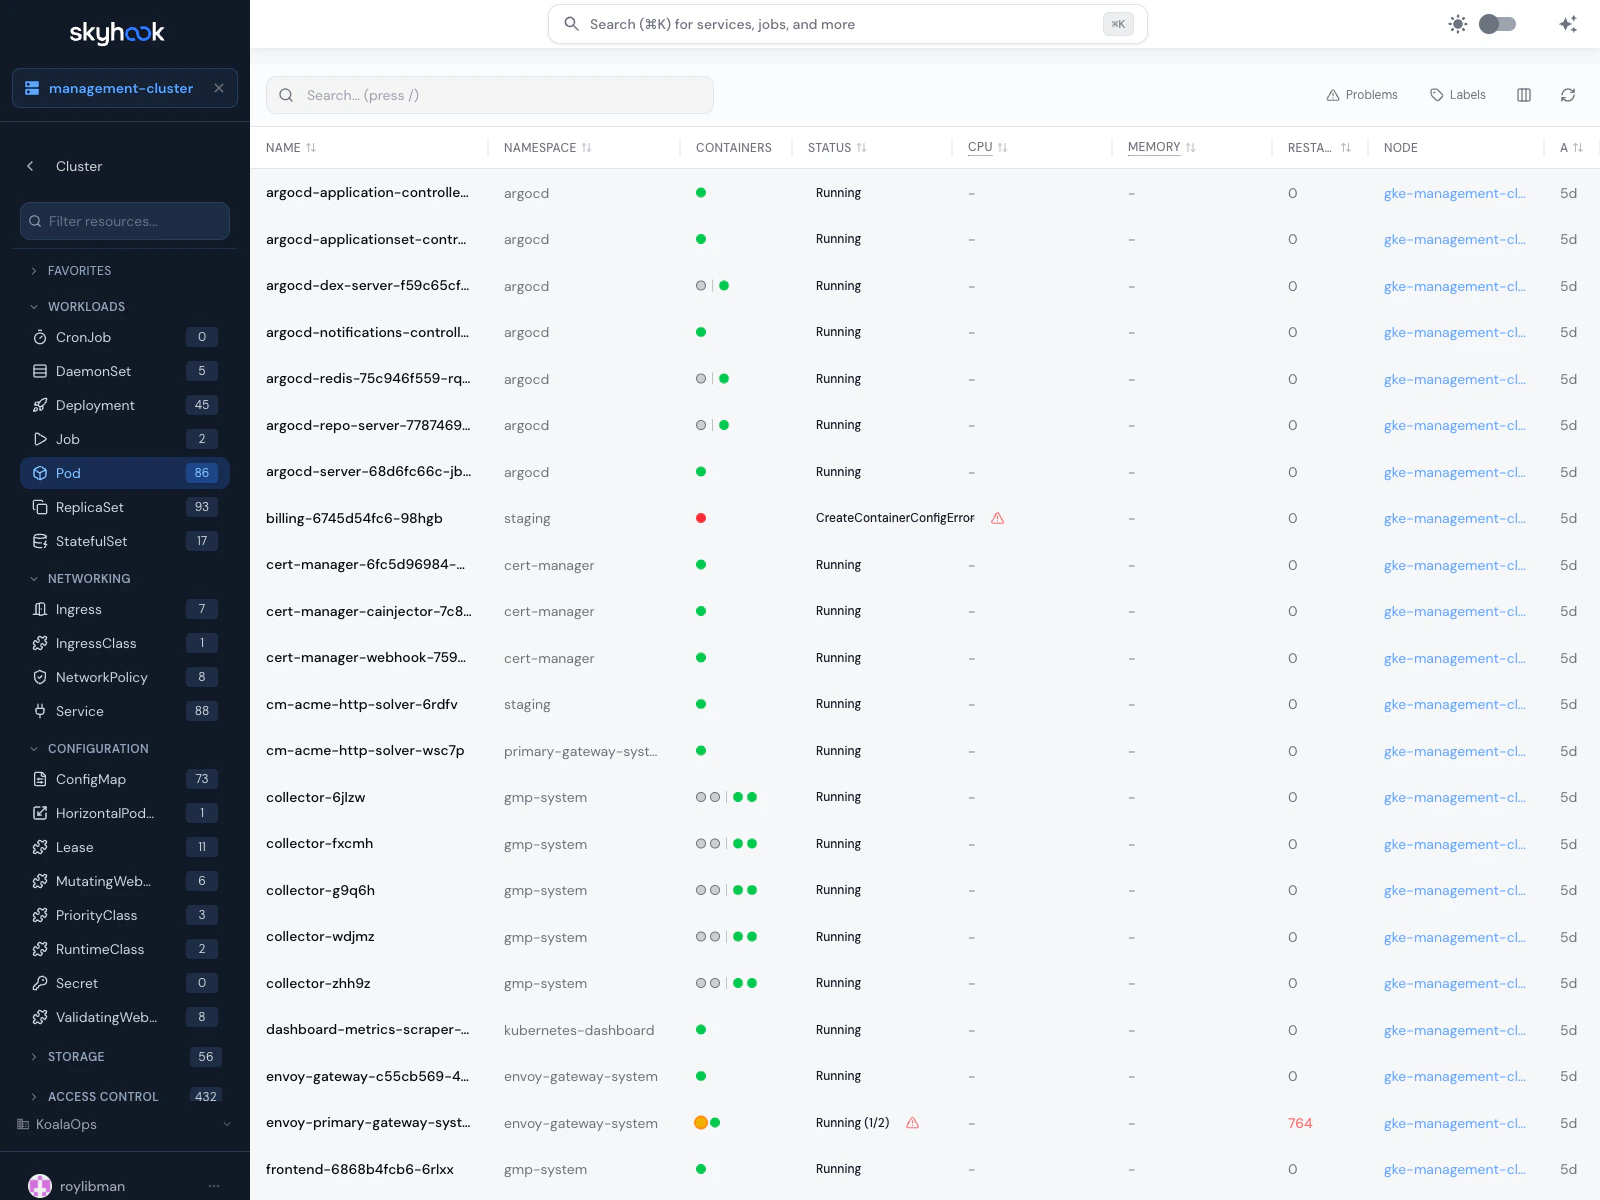
Sidebar navigation
The left sidebar groups resource kinds into categories:- Favorites — pin the kinds you look at most often
- Workloads — Deployment, StatefulSet, DaemonSet, Job, CronJob, ReplicaSet, Pod
- Networking — Service, Ingress, NetworkPolicy, Gateway, HTTPRoute
- Configuration — ConfigMap, Secret, HorizontalPodAutoscaler
- Storage — PersistentVolume, PersistentVolumeClaim, StorageClass
- Access Control — ServiceAccount, Role, RoleBinding, ClusterRole, ClusterRoleBinding
- Cluster — Node, Namespace, Event
- Custom Resources — any CRDs installed on the cluster (ArgoCD Application, Prometheus Rule, SealedSecret, VPA, etc.)
Search and filter
The search box at the top of the sidebar filters the resource list by name. Inside a resource kind, the main panel has its own search for cross-field matching (labels, annotations, owner references).Detail drawer
Click any resource to open a detail drawer with:- Summary — human-readable overview of the resource’s state
- YAML — raw Kubernetes resource spec with syntax highlighting
- Quick Commands — copy-paste kubectl commands for common operations
- Cloud console links — jump straight to the cloud provider console for cloud-managed resources (GKE nodes, EKS pods, etc.)
- Actions — scale, restart, or delete workloads directly from the drawer
Workload-specific views
Skyhook has purpose-built renderers for common workload kinds:- Deployment — rollout status, replica health, associated ReplicaSets
- Pod — container states, restart count, recent logs, events
- ReplicaSet — replica status, owner reference, revision, pod template
- Ingress — hosts, TLS configuration, backend services, unified status across rules
- Service — endpoints, ports, ClusterIP/LoadBalancer details
- Argo Rollouts — canary/blue-green progress, traffic split, analysis templates
Cluster Topology
Navigate to Clusters → <cluster> → Topology to open a visual map of the cluster’s workloads.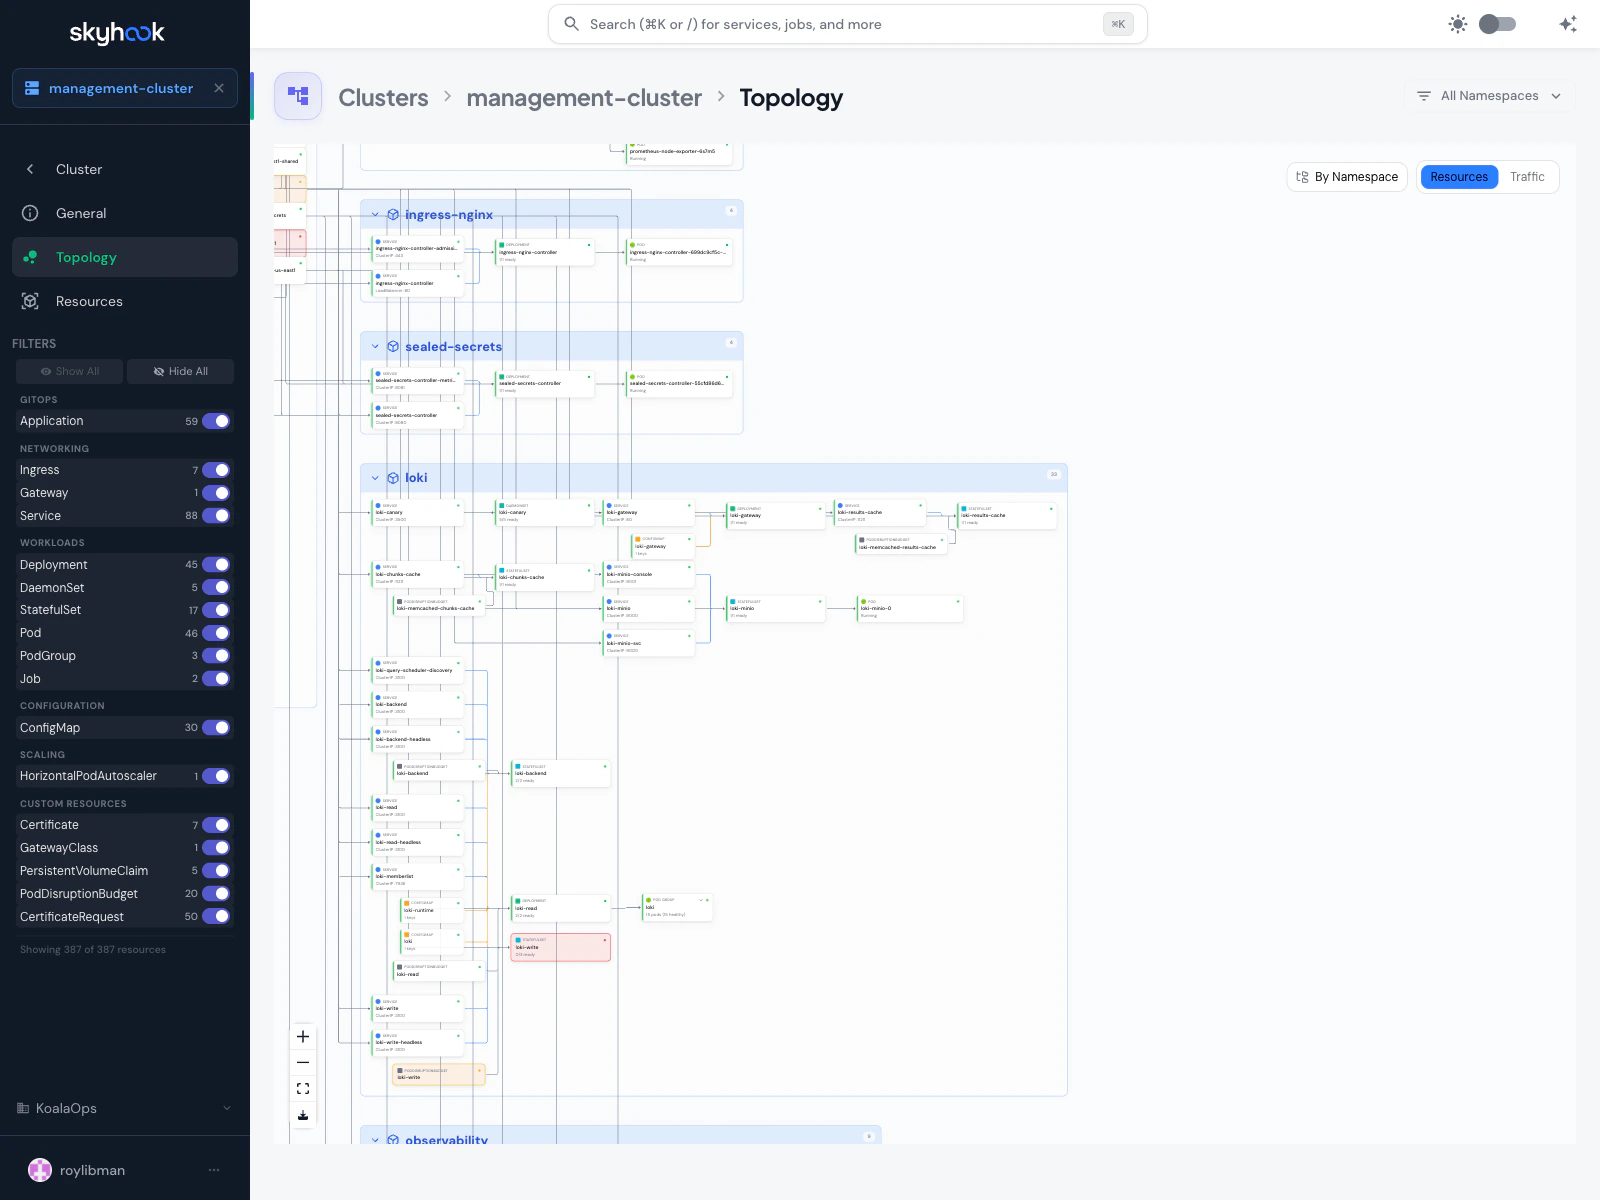
What you see
- Nodes in the graph represent Kubernetes resources — Deployments, ReplicaSets, Pods, Services, Ingresses, ConfigMaps
- Edges represent ownership (ReplicaSet belongs to Deployment) or traffic routing (Ingress → Service → Pods)
- Grouping — toggle between No Grouping, By Namespace, and By App Label
- Filters — the left sidebar lets you show or hide resources by kind (Ingresses, Services, Deployments, ReplicaSets, Pods, Namespaces, and any custom resources)
Use cases
- Sanity-check a deployment — at a glance, does the Deployment have the right number of replicas? Are the Pods healthy? Does the Service match?
- Find ownership chains — “which Deployment owns this Pod, and which Service routes to it?”
- Cross-namespace traffic — see which Ingresses route to Services in other namespaces
- Debug missing wiring — a Deployment that exists but has no Service pointing at it stands out visually
Traffic view
Toggle from Resources to Traffic to see the network flow between workloads, based on real-time service mesh or NetworkPolicy data.Service Runtime tab
Every service page has a Runtime tab that shows everything running for that service in a selected environment — the same kind of view as Cluster Topology but scoped to one service.Environment picker
A chip row at the top lets you switch between the service’s environments (autopush, dev, staging, prod). Switching re-queries the target cluster for live state.Resource Topology graph
Shows the service’s live Kubernetes resources and how they connect — Deployment → ReplicaSet → Pods, Service, Ingress, ConfigMap. Click any node to see details. Skyhook highlights ReplicaSet groups separately from the active ReplicaSet so you can see your rollout history at a glance without it cluttering the main graph. Old ReplicaSets from previous rollouts are collapsed into aReplicaSetGroup node.
Network Connectivity Monitoring
A dedicated card verifies your public endpoints are correctly configured and accessible, checking:- DNS — the ingress hostname resolves
- TLS — the certificate is valid and trusted
- HTTP — the endpoint responds (with status code)
- Backends — the pods behind the ingress are reachable
Kubernetes Resources list
Below the topology, a categorized list shows every Kubernetes resource that belongs to this service in the selected environment:- Ingresses — hosts and TLS state
- Services — ClusterIP / LoadBalancer and port mappings
- Deployments — ready state and rollout status
- ReplicaSets — current and historical (for rollback reference)
- Pods — running state per pod
- ConfigMaps — key count and content
Troubleshooting
'Cluster Not Found' on the Topology page
'Cluster Not Found' on the Topology page
Skyhook can’t reach the cluster agent for that cluster, or the cluster has been removed. Open the Clusters list to verify the cluster is still registered and the agent is online.
Resources show stale data
Resources show stale data
The resource browser pulls live from the cluster via the agent. If you see stale data, the agent may have lost its connection to Skyhook temporarily. Hard-refresh the page to re-query.
Runtime tab shows 'Failed to load ingress status'
Runtime tab shows 'Failed to load ingress status'
The ingress exists in the cluster but Skyhook can’t determine its public accessibility state. Common causes: the ingress controller isn’t installed, the DNS record hasn’t propagated, or the TLS certificate is still being issued. Check the ingress directly in the Cluster Resources browser to see its raw state.
Topology graph is empty
Topology graph is empty
Verify the namespace filter (top-right) isn’t hiding everything. If the filter is set to a specific namespace with no resources, the graph will be empty. Switch to All Namespaces to see the full cluster.