- Deploy — starting a new deployment
- Deployments — history, filters, and status
- Deployment detail — everything about a single deploy, including build and deploy logs
Starting a deployment
Click Deploy… at the top of any service page.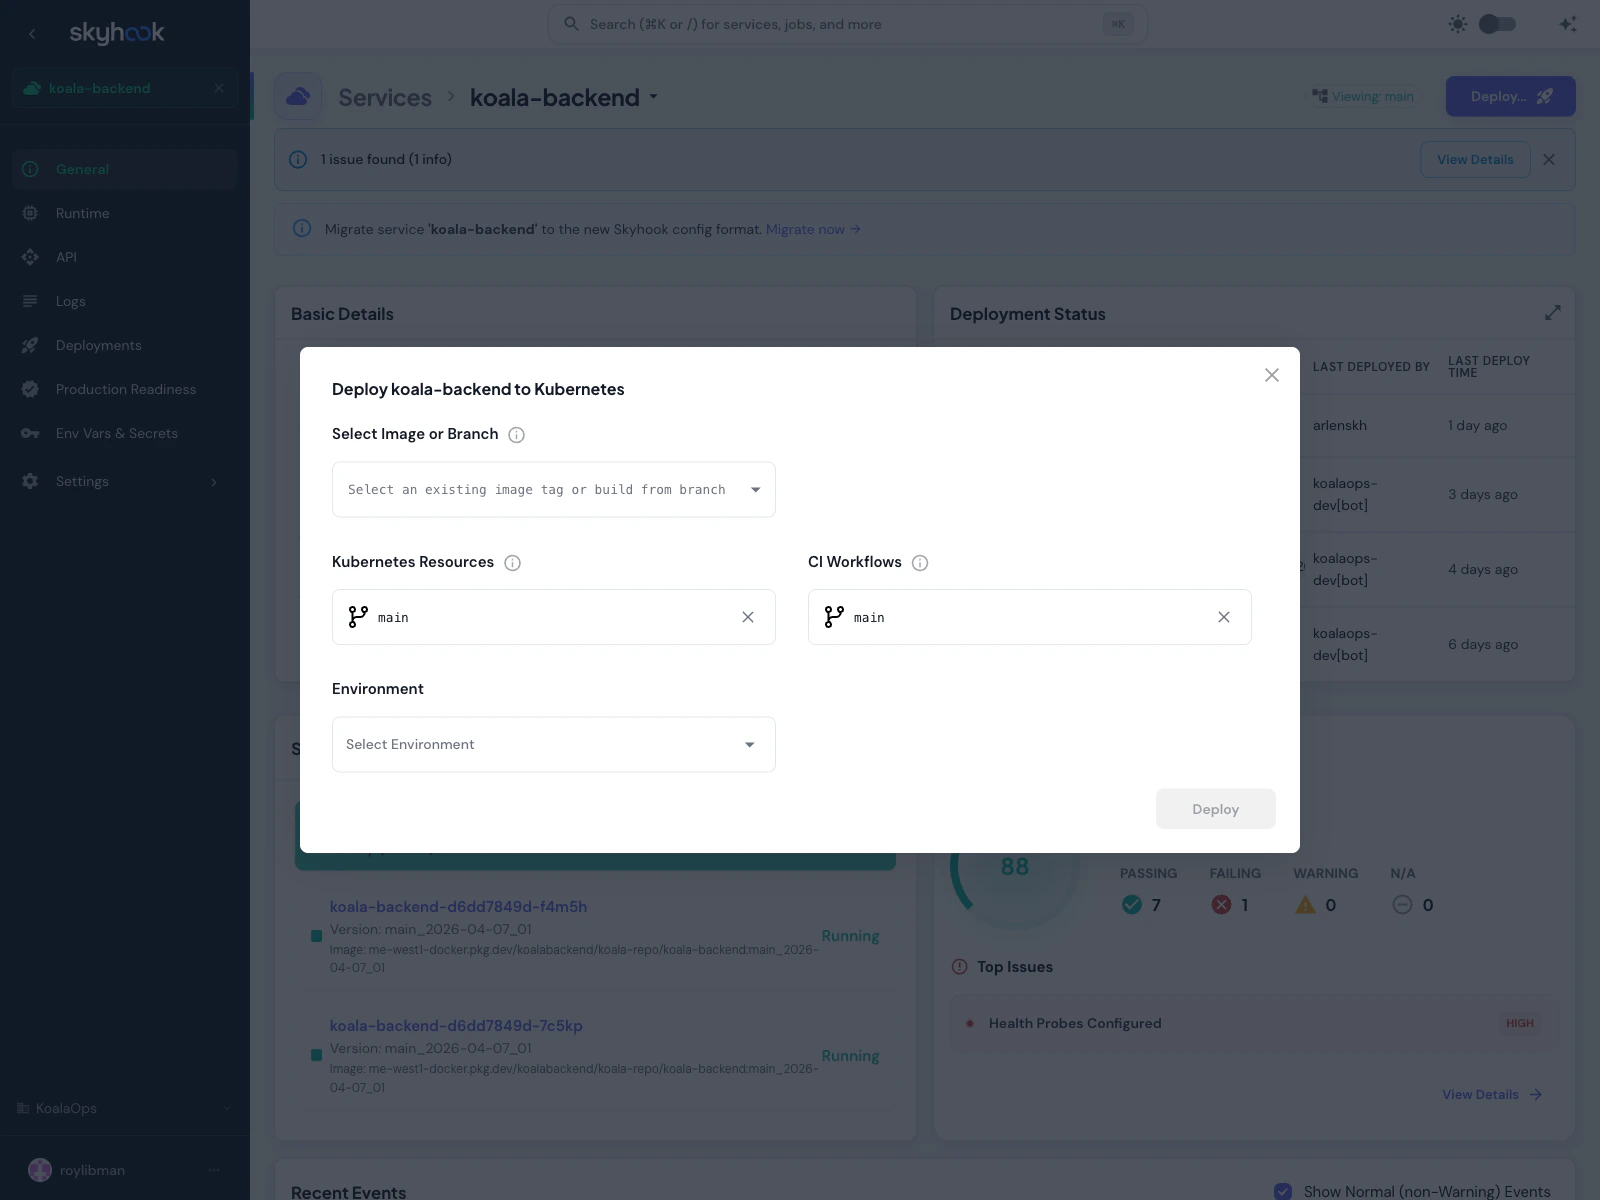
Select Image or Branch
What you want to deploy:- Pick an image tag — deploy an image that’s already been built (for example, promoting a tested staging build to production)
- Pick a branch — build a fresh image from the latest commit on that branch, then deploy it
Kubernetes Resources
The branch or tag to take your deployment manifests from. Defaults to your repository’s default branch — whatever it’s called in your repo — so most of the time you don’t touch this. Change it when you want to deploy a feature that needs bundled configuration changes, like a new ingress rule or autoscaling policy.CI Workflows
The branch or tag for your CI workflow files. Also defaults to the default branch. Kept separate from Kubernetes Resources because some teams pin workflows tomain even when building from a feature branch.
Environment
Where to deploy. The dropdown lists the environments configured for this service. See Environments for how to add or manage them. Click Deploy and Skyhook starts the workflow. The deployment appears at the top of the Deployments list with a live status indicator.Deployments list
The Deployments tab on any service shows every past deployment with filters for anything you might want to find.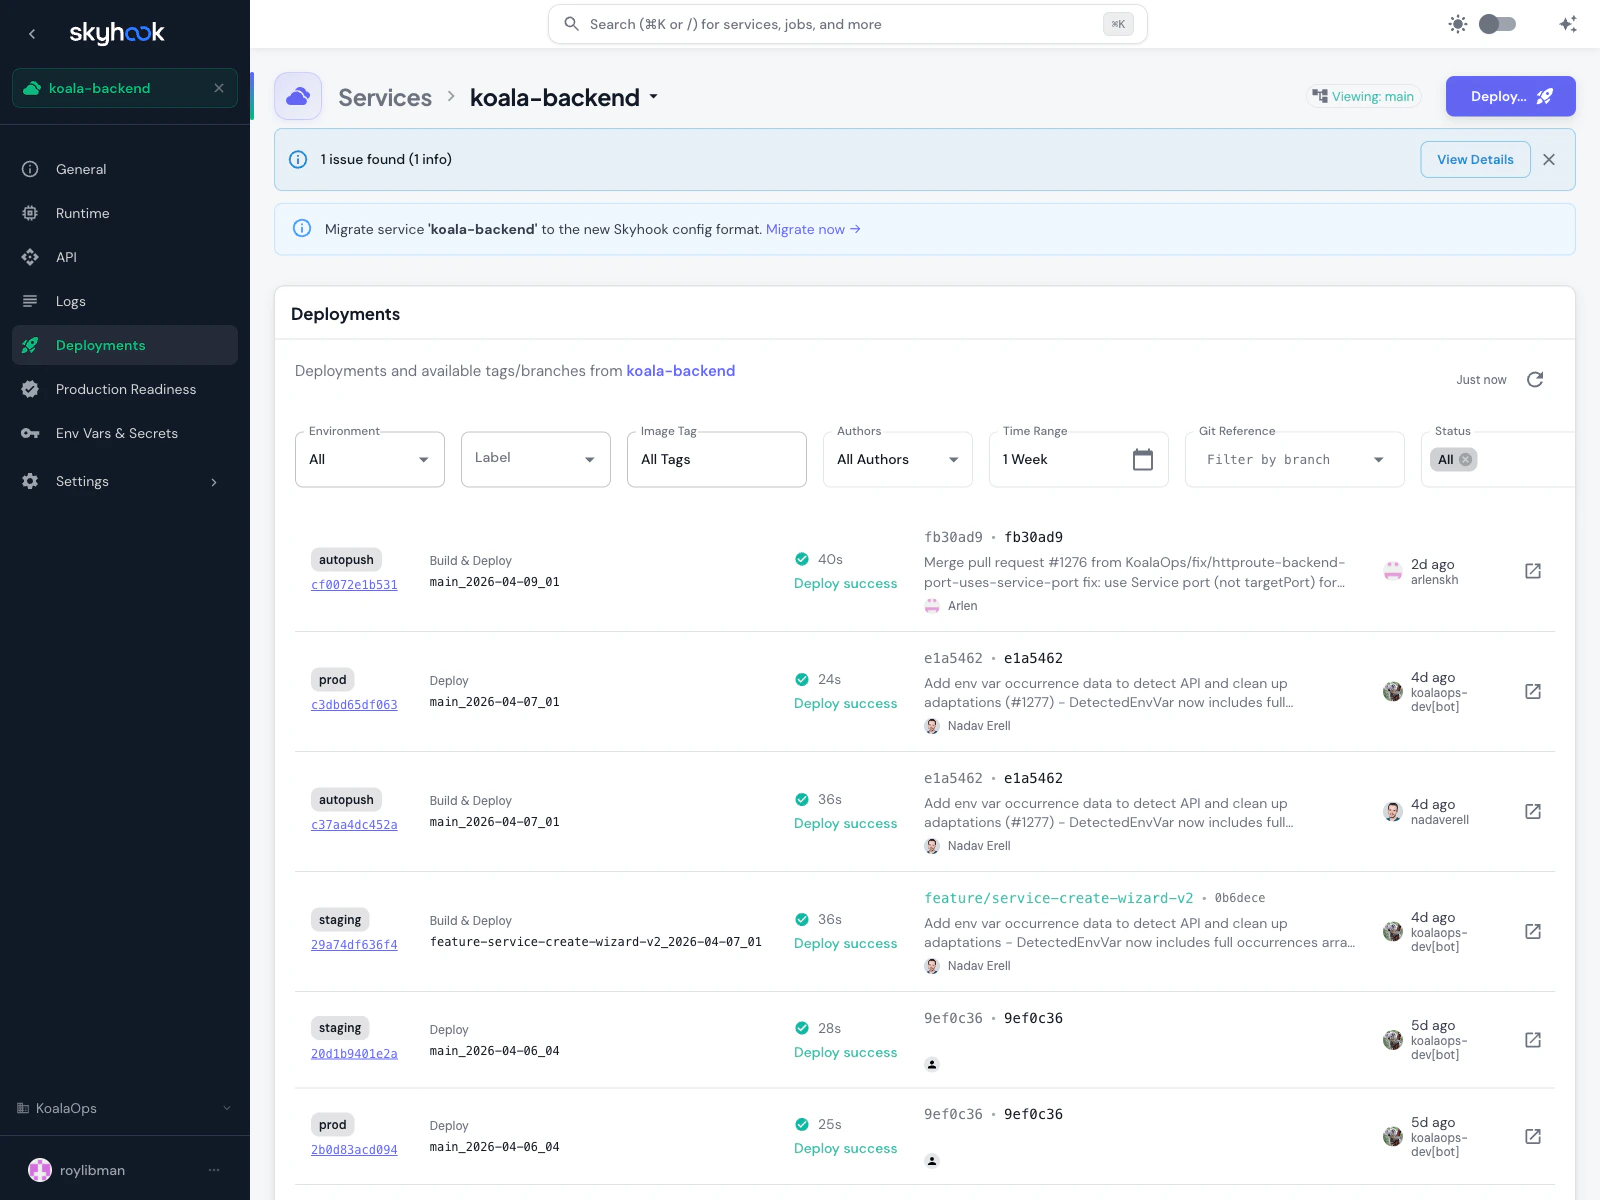
Filters
Filter by any combination of:- Environment — show deployments to specific environments
- Label — filter by environment label, e.g. show all deployments to environments tagged
region:us-east - Image Tag — find deployments of a specific image
- Authors — filter by who committed the code
- Time Range — last hour, day, week, month, or a custom range
- Git Reference — filter by branch or tag
- Status — All, success, in progress, or failed
What each row shows
- Environment — where it went
- Type — whether it deployed an existing image or built a new one first
- Image Tag — what was deployed
- Duration — how long the deployment took
- Status — success, in progress, or failed
- Git Reference — the commit with its message
- Author — who wrote the code
- Time — when it happened
- Triggered by — who started the deployment (not always the same as the code author)
Deployment detail
Click any row in the list to open the deployment detail page.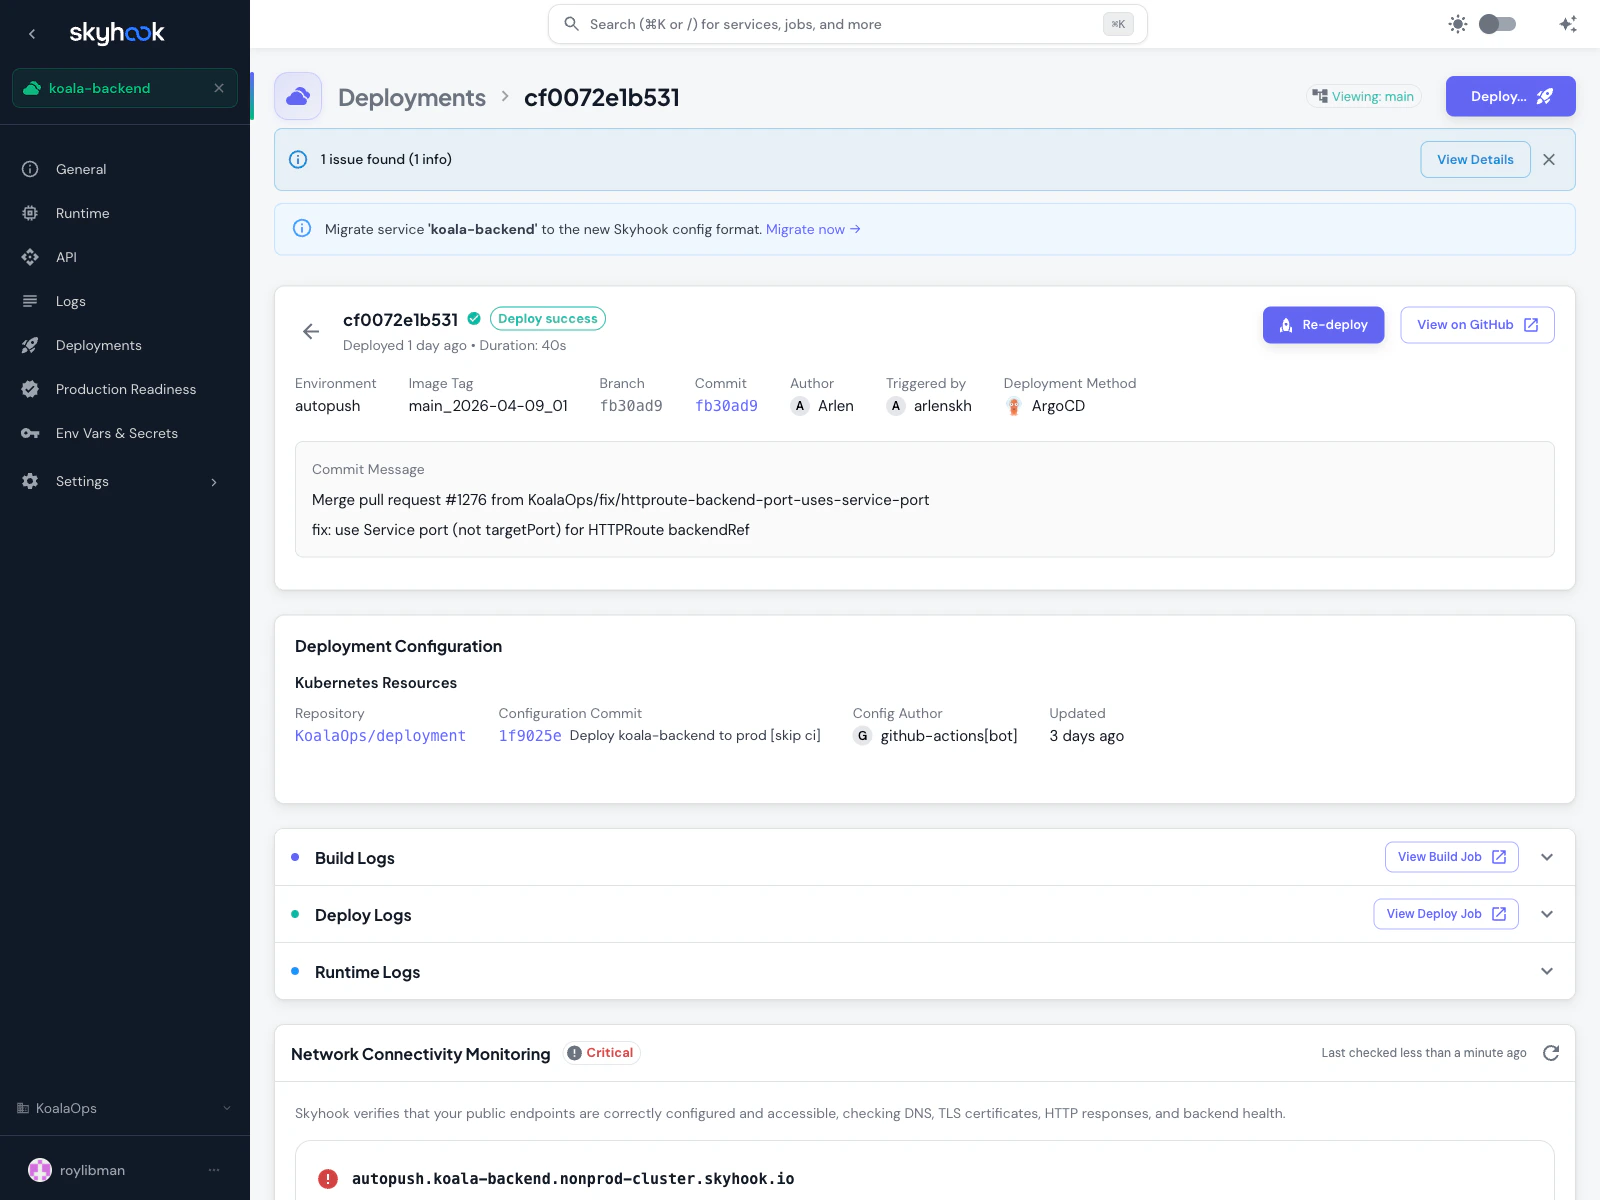
What you see
- Status — success, in progress, or failed, with how long it took and when it ran
- Re-deploy — runs the same deployment again (useful for recovering from a transient failure)
- View on GitHub — jumps to the underlying workflow run
- Metadata — environment, image tag, branch, commit, author, who triggered it, and the deployment method (Skyhook shows an ArgoCD badge when the deployment ran through ArgoCD)
- Commit message — the first line or two of the commit being deployed
- Deployment Configuration — which deployment repository, which configuration commit, and who last touched it
Build, deploy, and runtime logs
Three collapsible sections at the bottom of the page show:- Build Logs — output from the build job
- Deploy Logs — output from the deploy job
- Runtime Logs — live logs from the running pods (links into the Logs viewer)
In-app log viewer
Skyhook renders build and deploy logs with a dedicated viewer tuned for CI output — you don’t need to click through to GitHub to read them.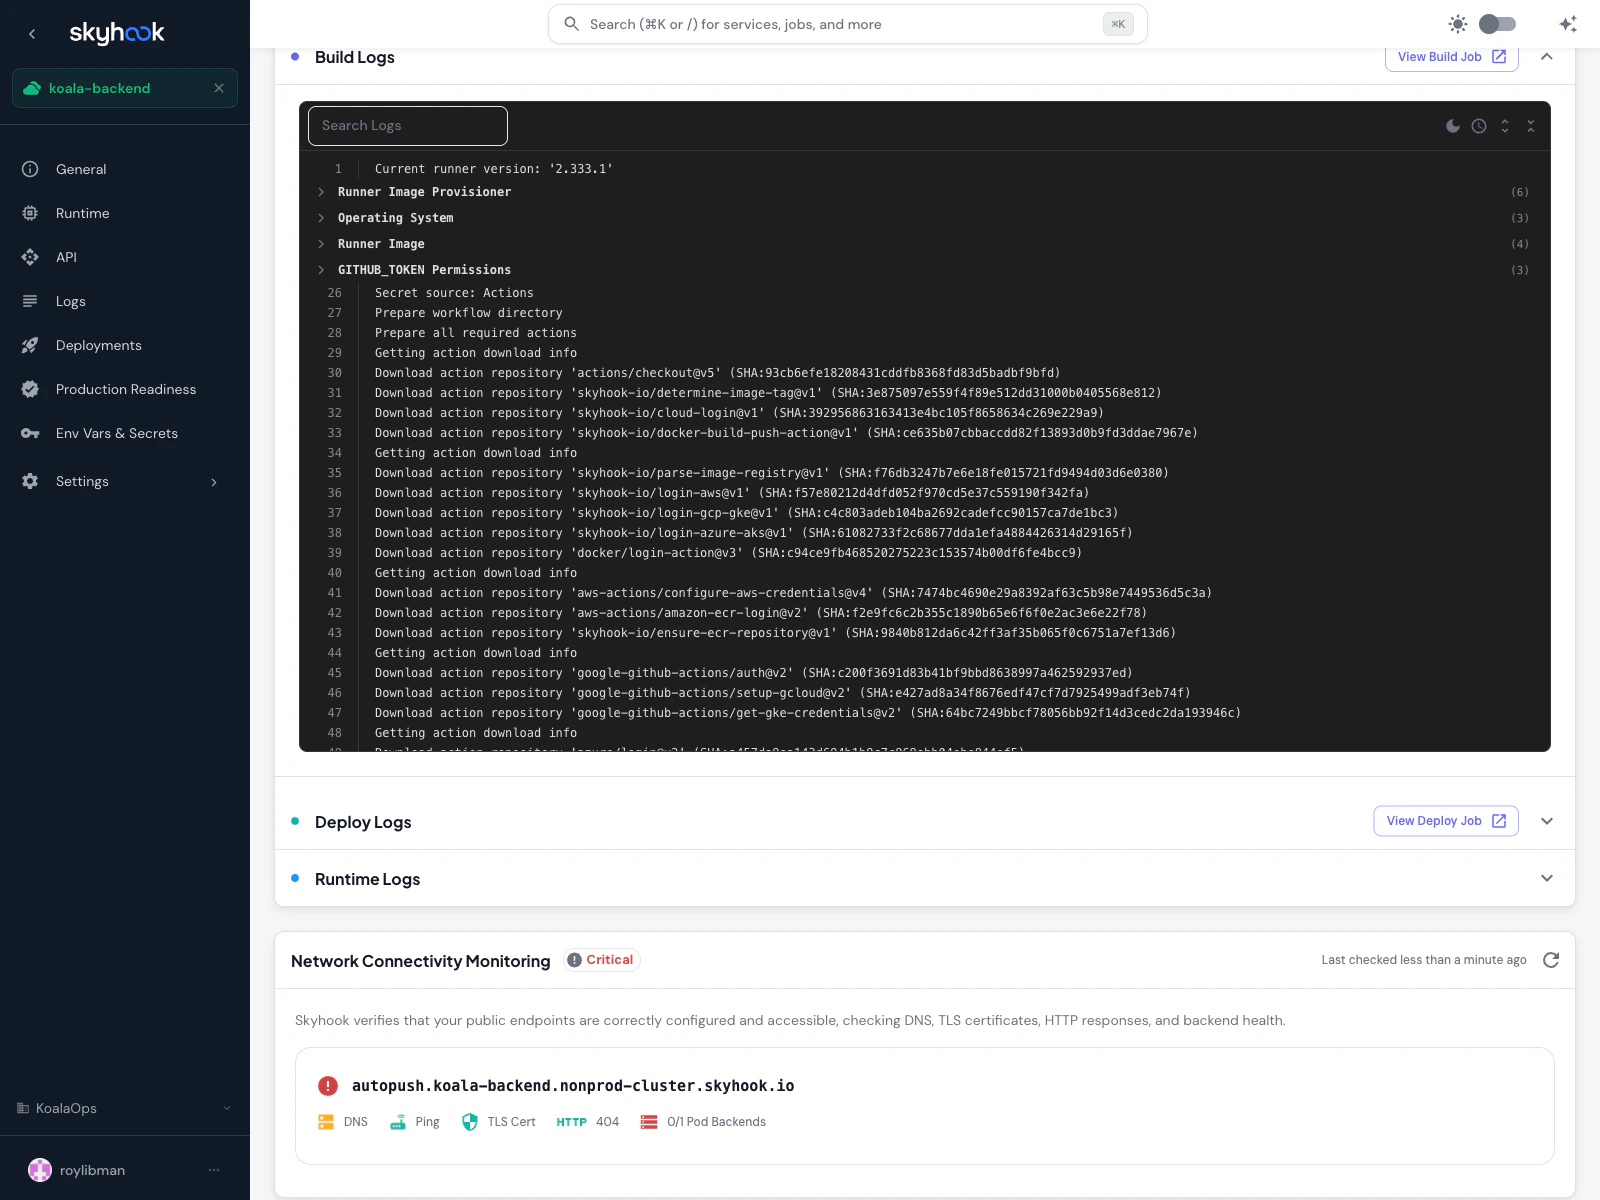
- Collapsible groups — sections of the log fold open and closed so you can skip past the noise
- Error and warning highlighting — mistakes are colored and easy to spot
- Search with match navigation — find text and jump between matches with arrow keys
- Line numbers — toggle on or off, useful when referring to a specific line in a bug report
- Timestamps — toggle on or off
- Color output — ANSI colors from your build scripts render correctly (bold, dim, 16 colors, 256 colors, true color)
- Dark or light theme — switch with a single click
- Live streaming — if the job is still running, new lines appear as they’re produced
Network connectivity check
For services with ingress configured, the deployment detail page shows a connectivity check card that verifies your public endpoints are working after the deploy lands:- DNS — the ingress hostname resolves
- TLS — the certificate is valid and trusted
- HTTP — the endpoint responds (with the status code)
- Backends — the pods behind the ingress are reachable
Re-deploying
The Re-deploy button on a deployment detail page replays that deployment exactly — same image, same configuration, same environment. It’s the fastest way to:- Recover from a transient infrastructure failure mid-deploy
- Roll forward to retry after a GitOps sync interruption
- Roll back to a previous successful deploy (open an older one from the list and hit Re-deploy)
Troubleshooting
Deploy Logs shows nothing
Deploy Logs shows nothing
Either the deploy job hasn’t started yet (the build is still running) or the deploy job was skipped because the build job failed. Click View Deploy Job to see the state on GitHub — if it shows “skipped”, open Build Logs to find the real failure.
No ArgoCD badge on a deployment I know used ArgoCD
No ArgoCD badge on a deployment I know used ArgoCD
Very old deployments created before Skyhook started recording the deployment method won’t show the badge. New deployments display it correctly.
My CI workflow ignored the ref I picked
My CI workflow ignored the ref I picked
Current generated workflows declare a
ref input, so this only affects older or heavily customized workflow files. If a workflow doesn’t declare ref, Skyhook falls back to the head of the target branch. The quickest fix is skyhook update cicd --reset to regenerate from the current template; if you need to keep customizations, add a workflow_dispatch input named ref yourself (see Troubleshooting → CI workflow ignores the ref you picked).Search in the log viewer isn't finding colored text
Search in the log viewer isn't finding colored text
The search matches the plain text content, not the color codes. Search for the word you’re looking for directly and it’ll work — just don’t include any formatting characters.
Further Reading
- Ship Without Fire Drills: Canary, Blue-Green, and Rolling Deploys - comparing deployment strategies and when to use each